
Everything Matmon does
A compact, self-hosted alternative to the classic monitoring suites – small enough for a home lab, built on the same ideas as the big ones.
One tree for everything
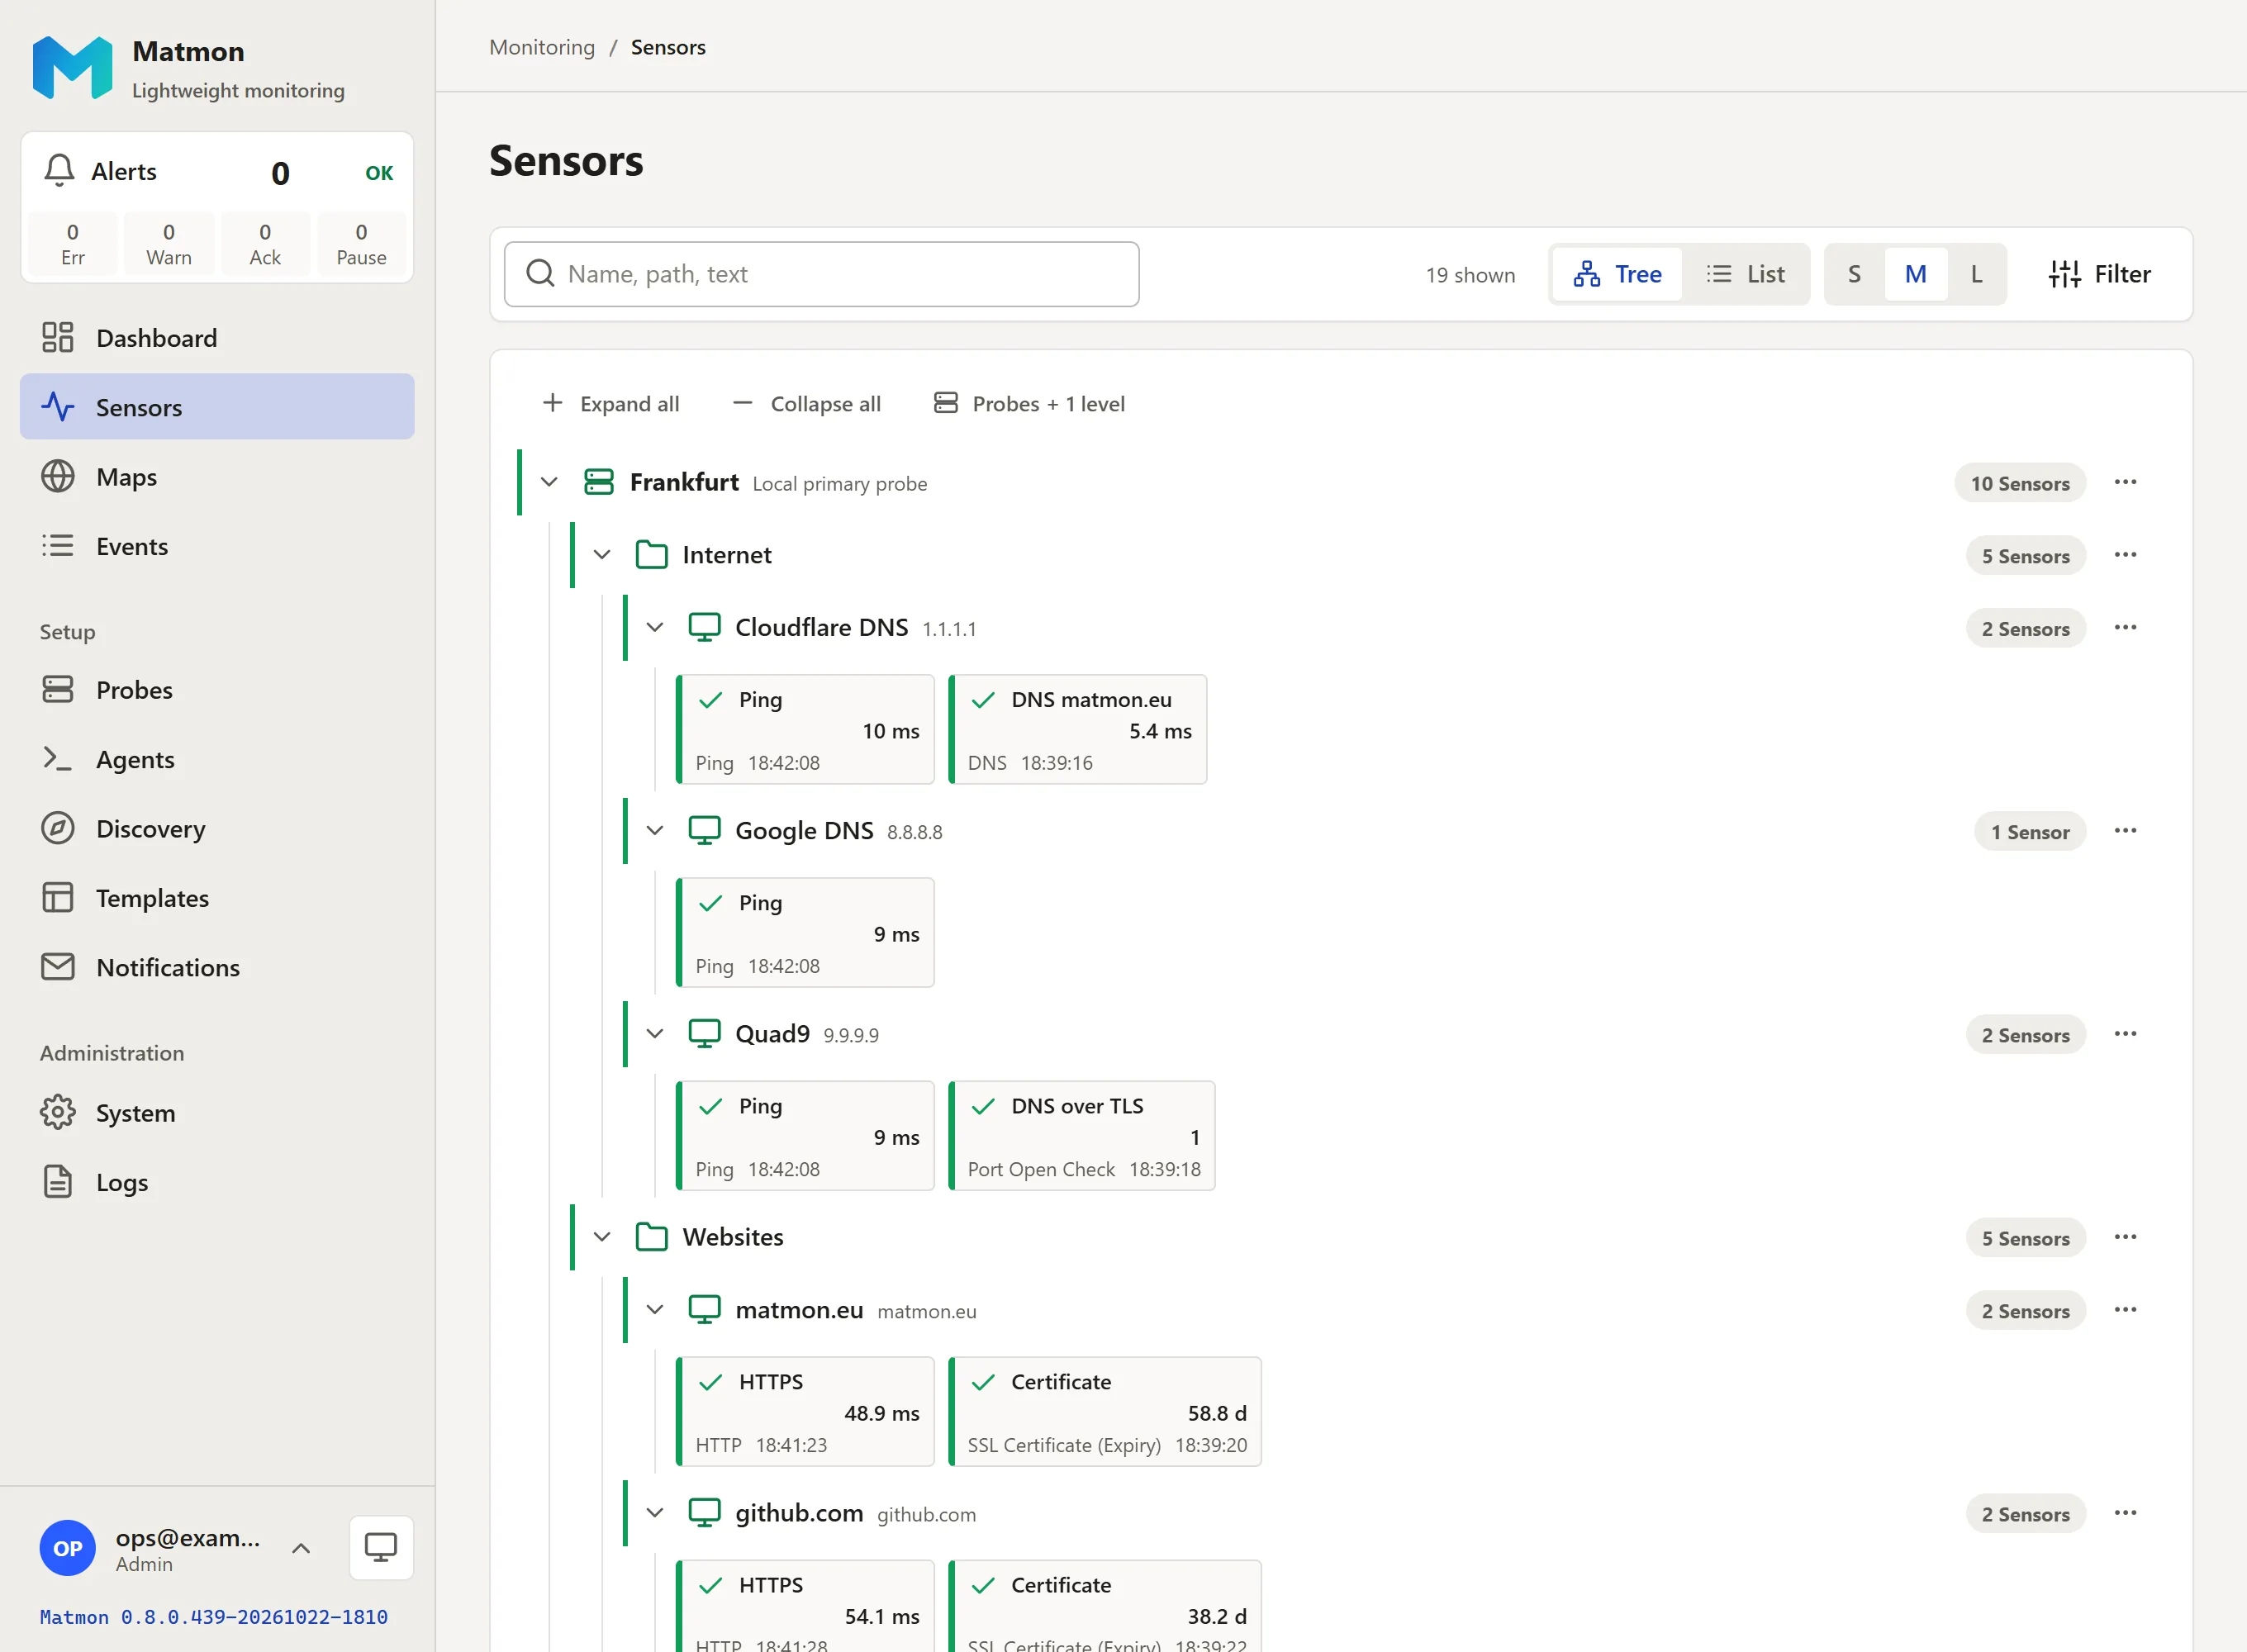
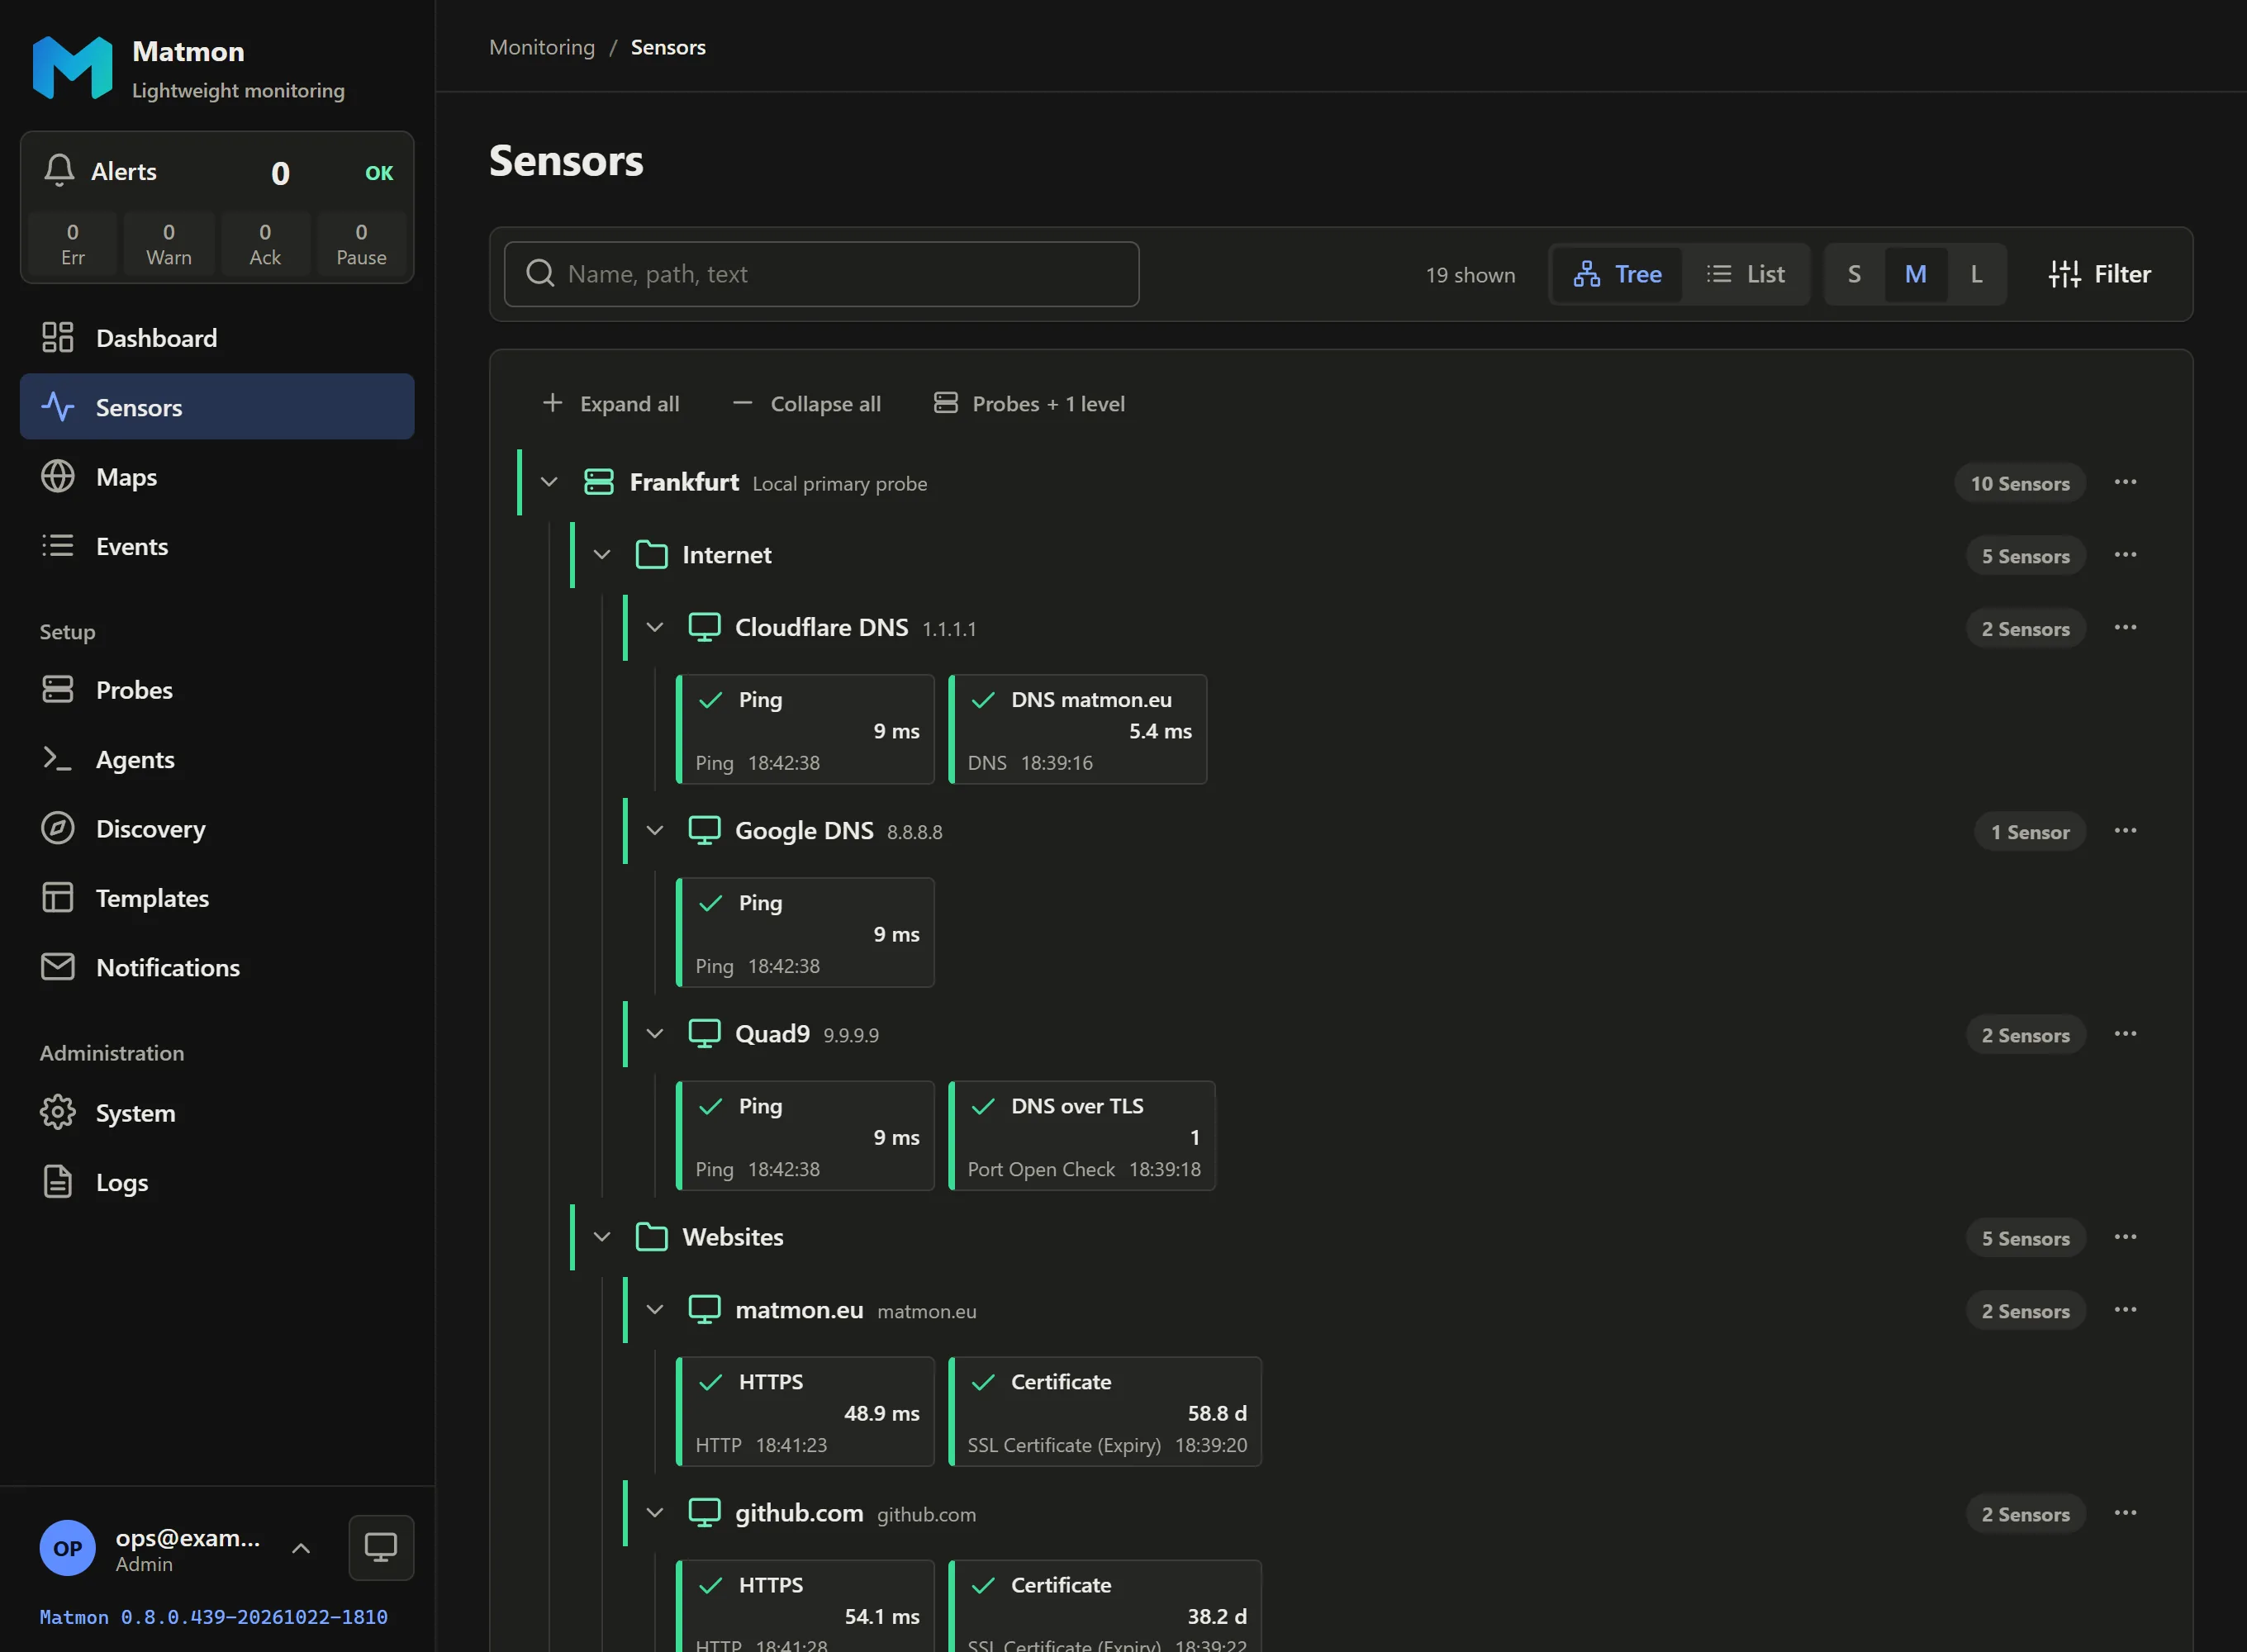
Probes, folders, hosts and sensors in one tree. Settings, schedules and credentials inherit from above – a sensor overrides only what differs.
- Templates for reusable setups, tags that cascade
- Per-channel thresholds with sensible defaults
- Schedules every N, daily, weekly or monthly – with a preview of the next runs
- Discovery finds the devices on your network; drag and drop rearranges the tree
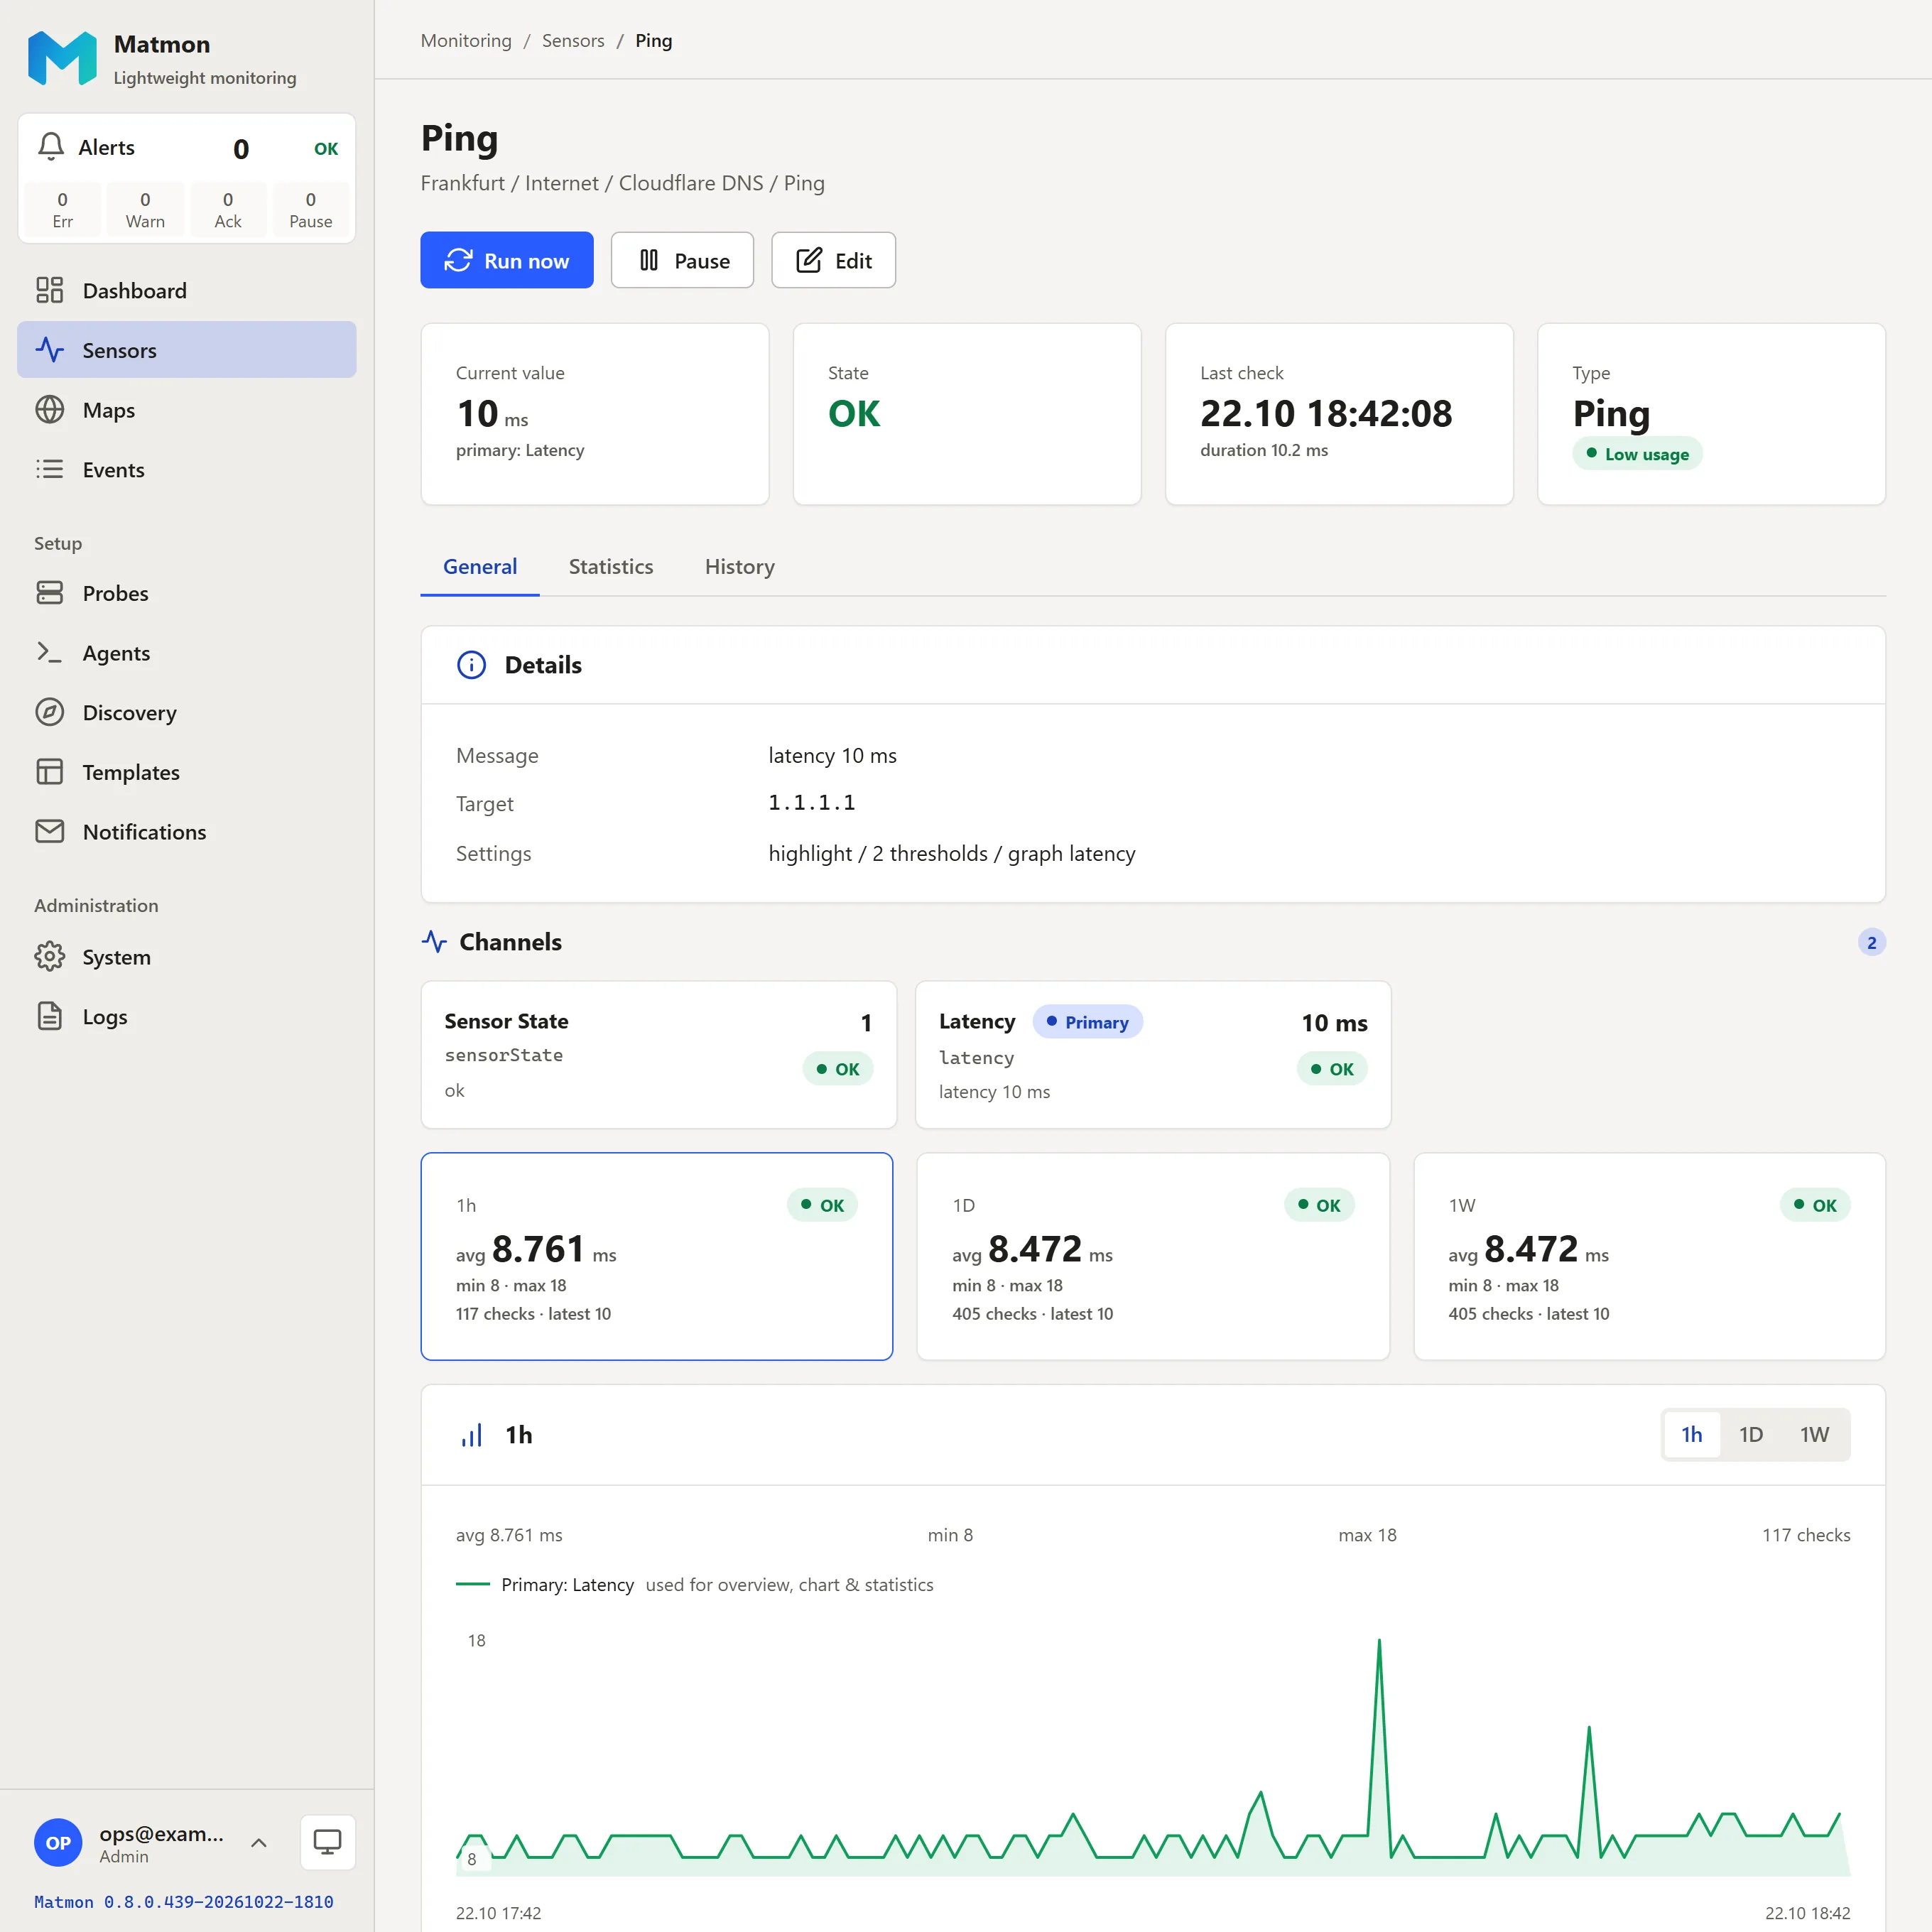
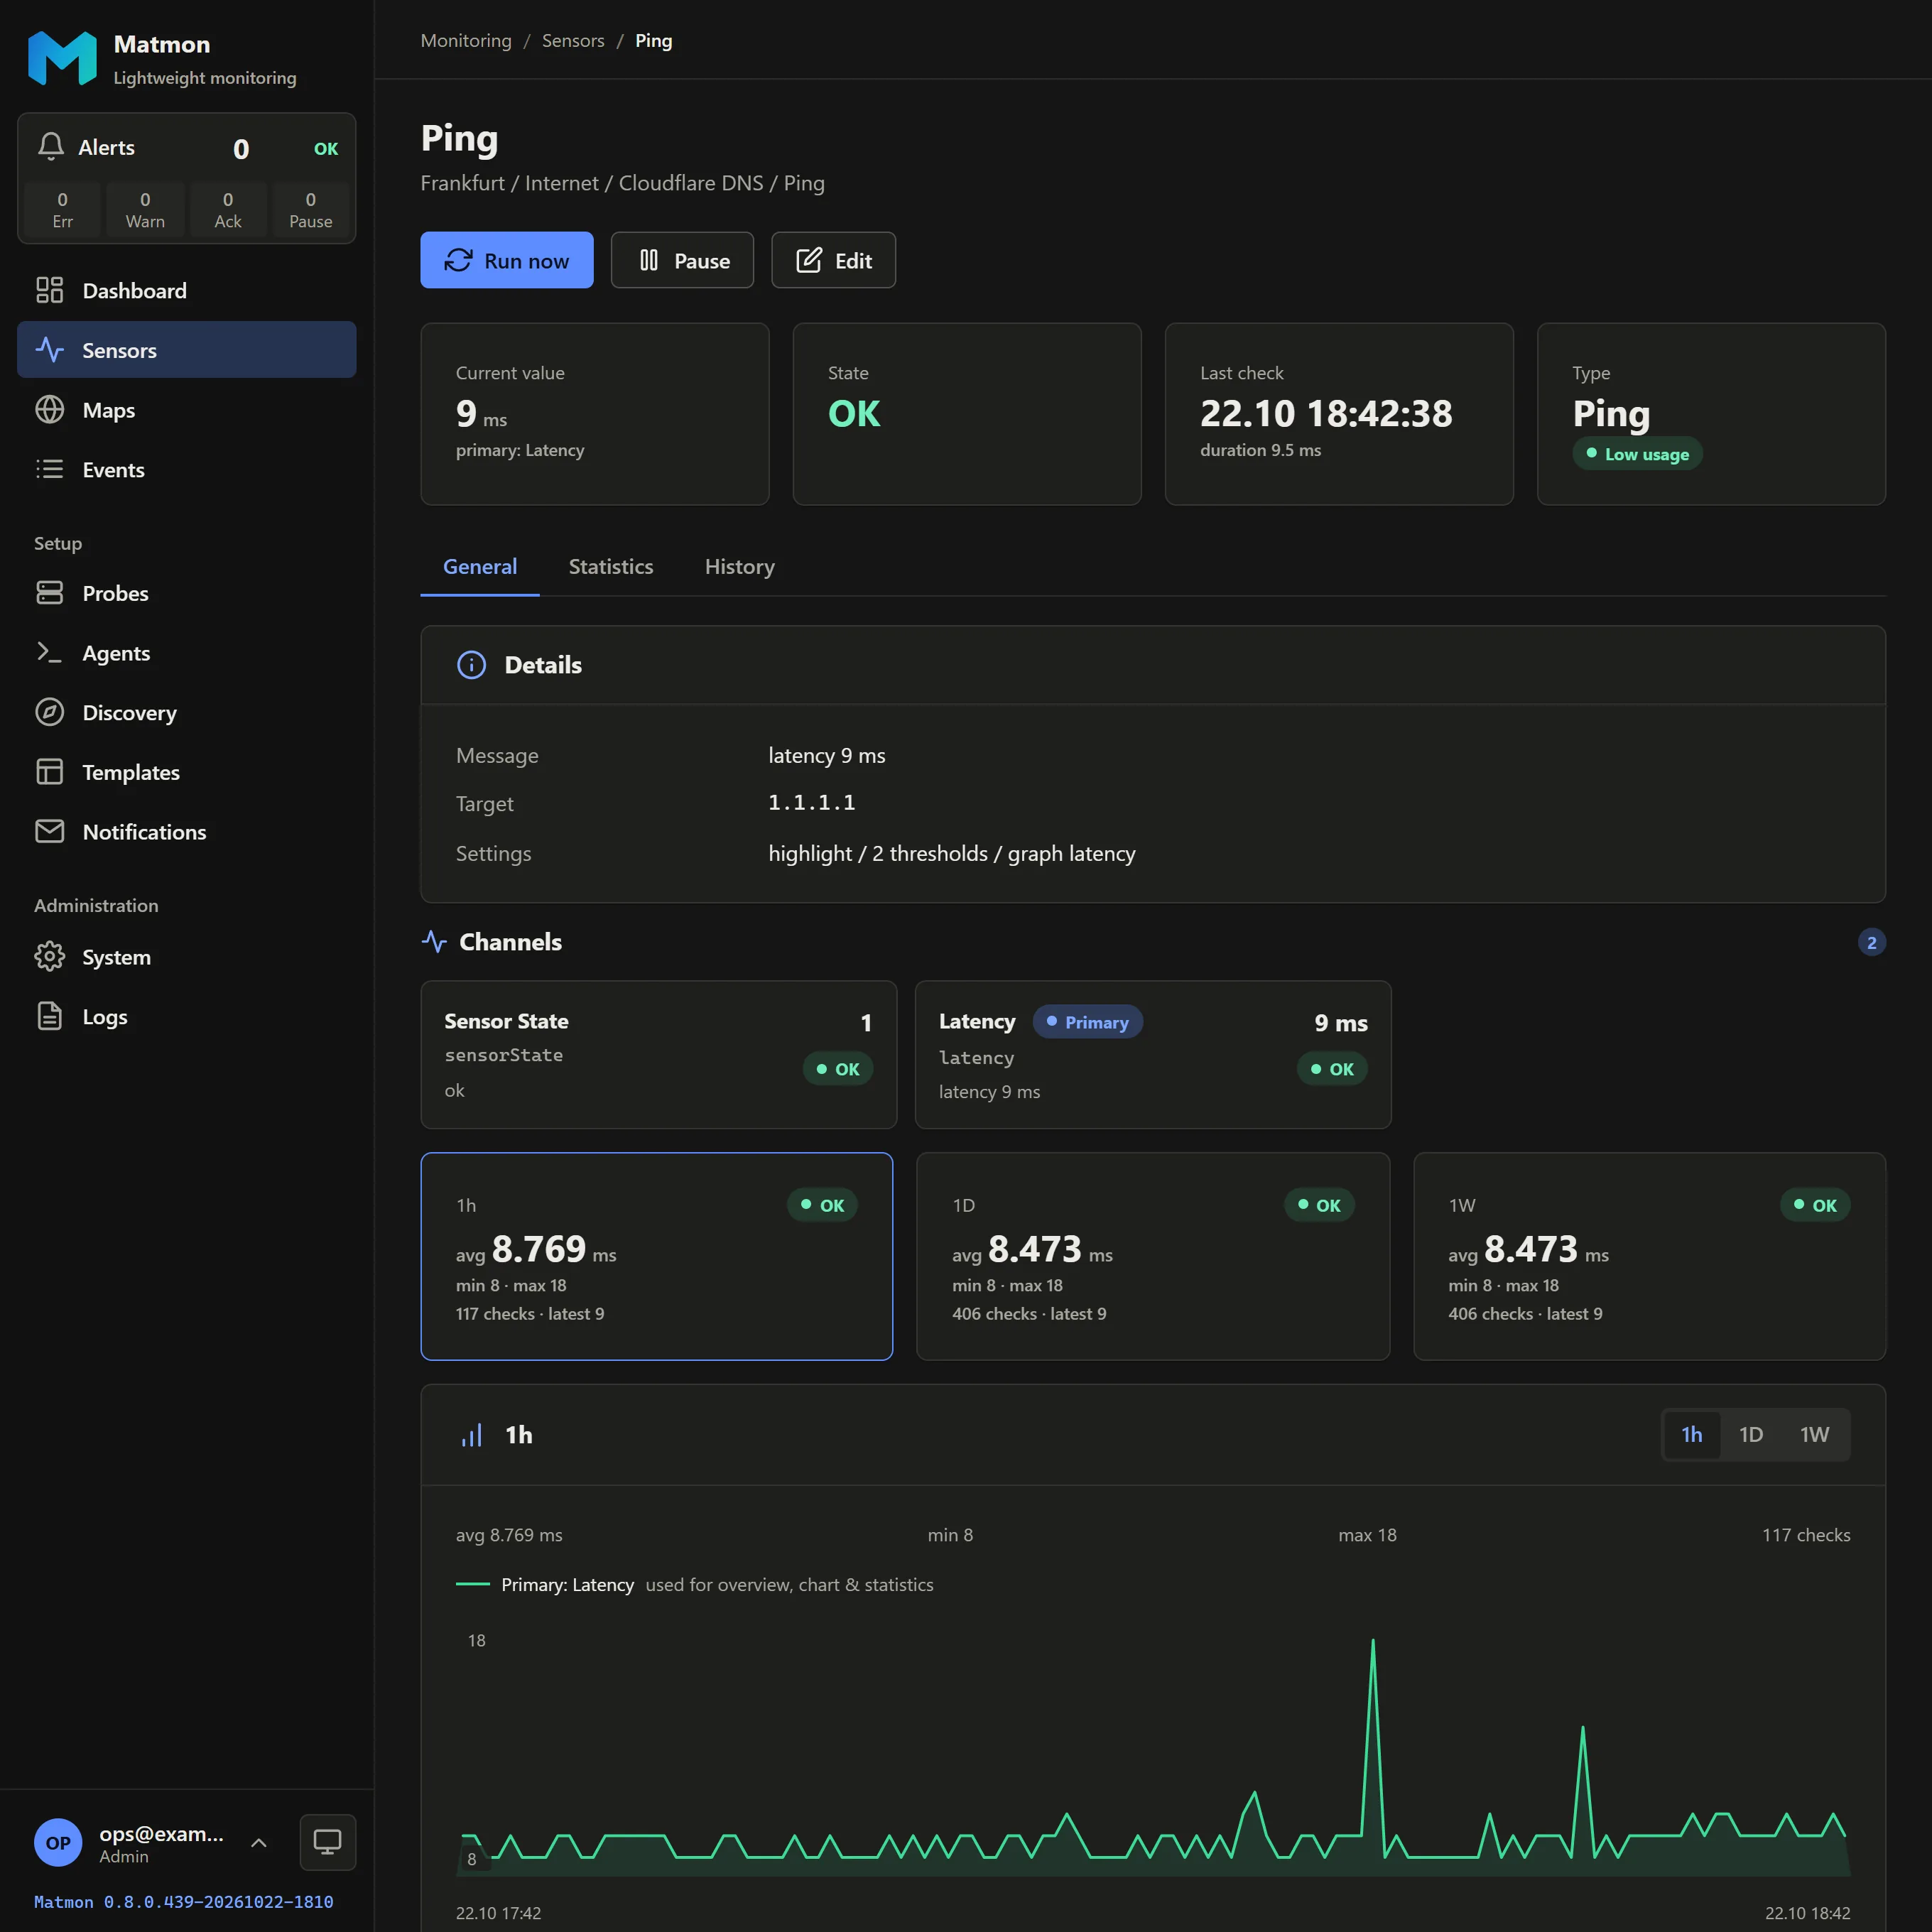
- Statistics per channel: average, min, max, percentiles and uptime
Over 40 sensor types, no add-ons
- Reachability: ping, HTTP(S), TCP port, DNS, NTP, SSL certificate and chain, domain expiry
- Network: SNMP with a MIB library, interfaces with traffic and utilisation, FRITZ!Box, OPNsense
- Platforms: Proxmox and Proxmox Backup Server, VMware, Hyper-V, Synology, UniFi, Windows and Linux health
- Hardware: server controllers over Redfish (iDRAC, iLO …), printers, UPS over SNMP or NUT
- Services: SQL databases, Docker, LDAP / Active Directory, SIP, mail round-trip
- Scripts and jobs: PowerShell, local scripts, and a push (heartbeat) address for cron and backups
Alerts that reach the right person
Alerts stay until someone acknowledges them, can be muted, and recover on their own.
- Alert delay: a blip never alarms; escalation in up to three steps
- Dependencies: one outage, one alert – not thirty
- Maintenance windows for patch night
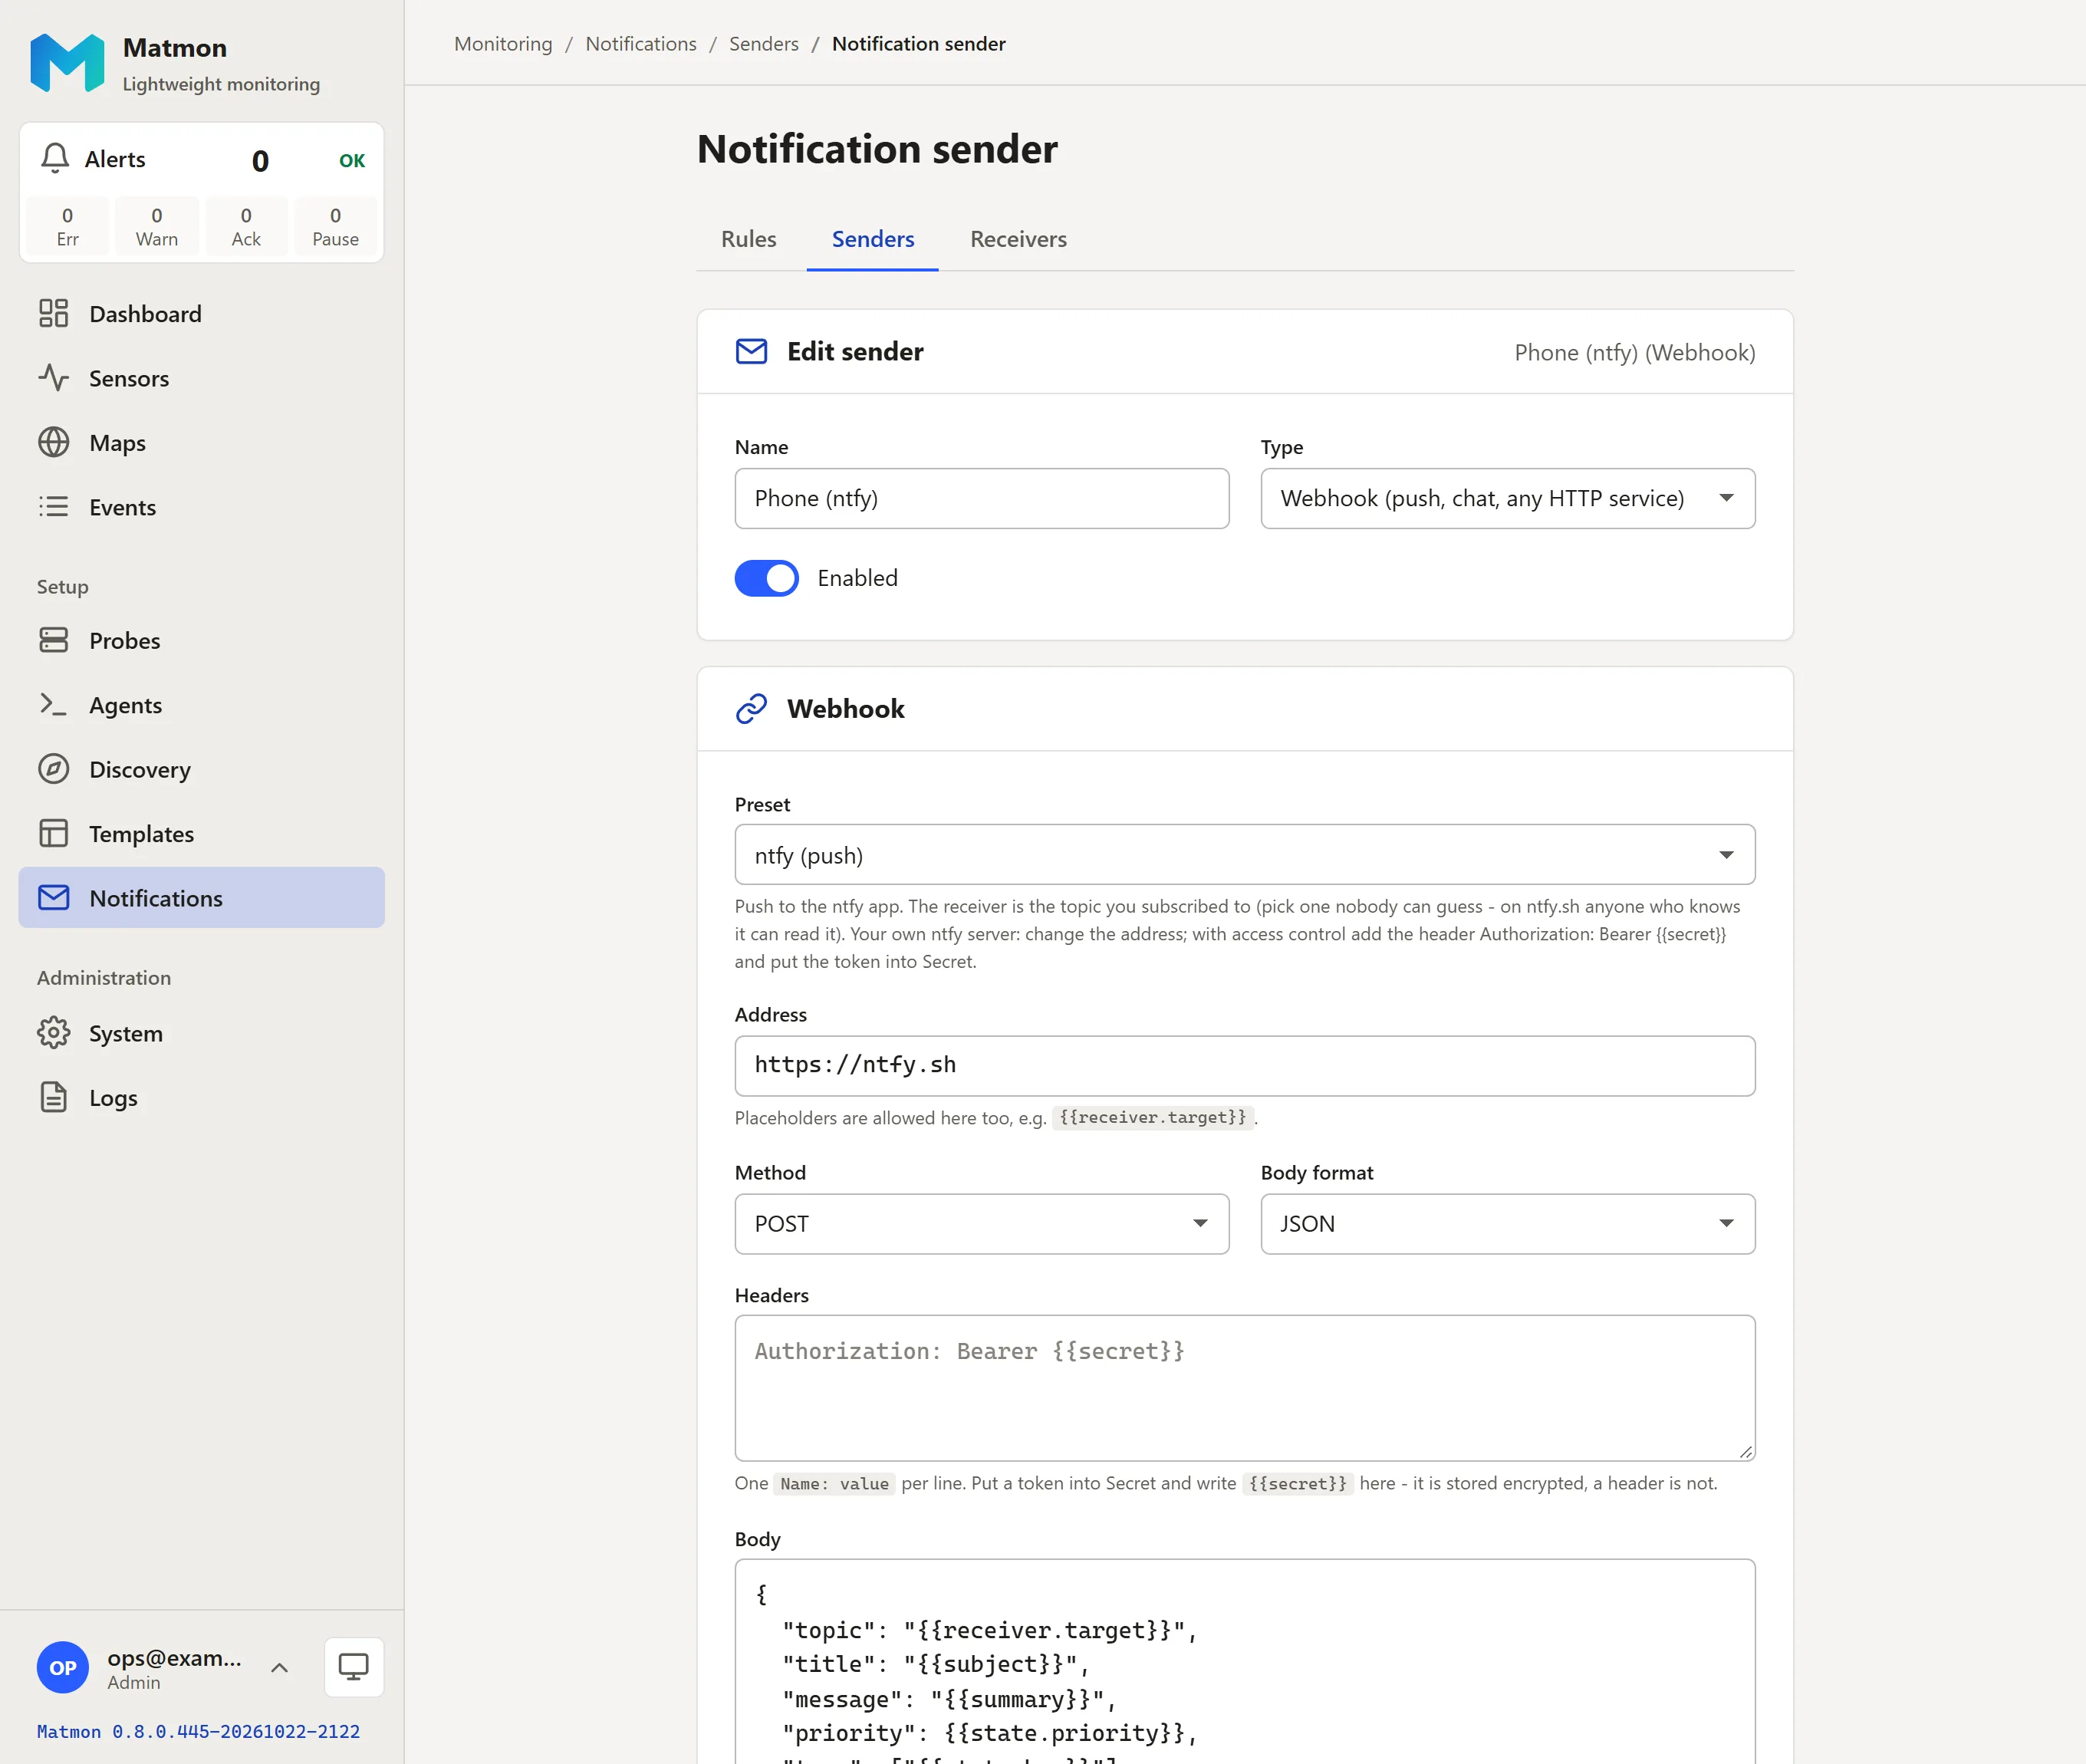
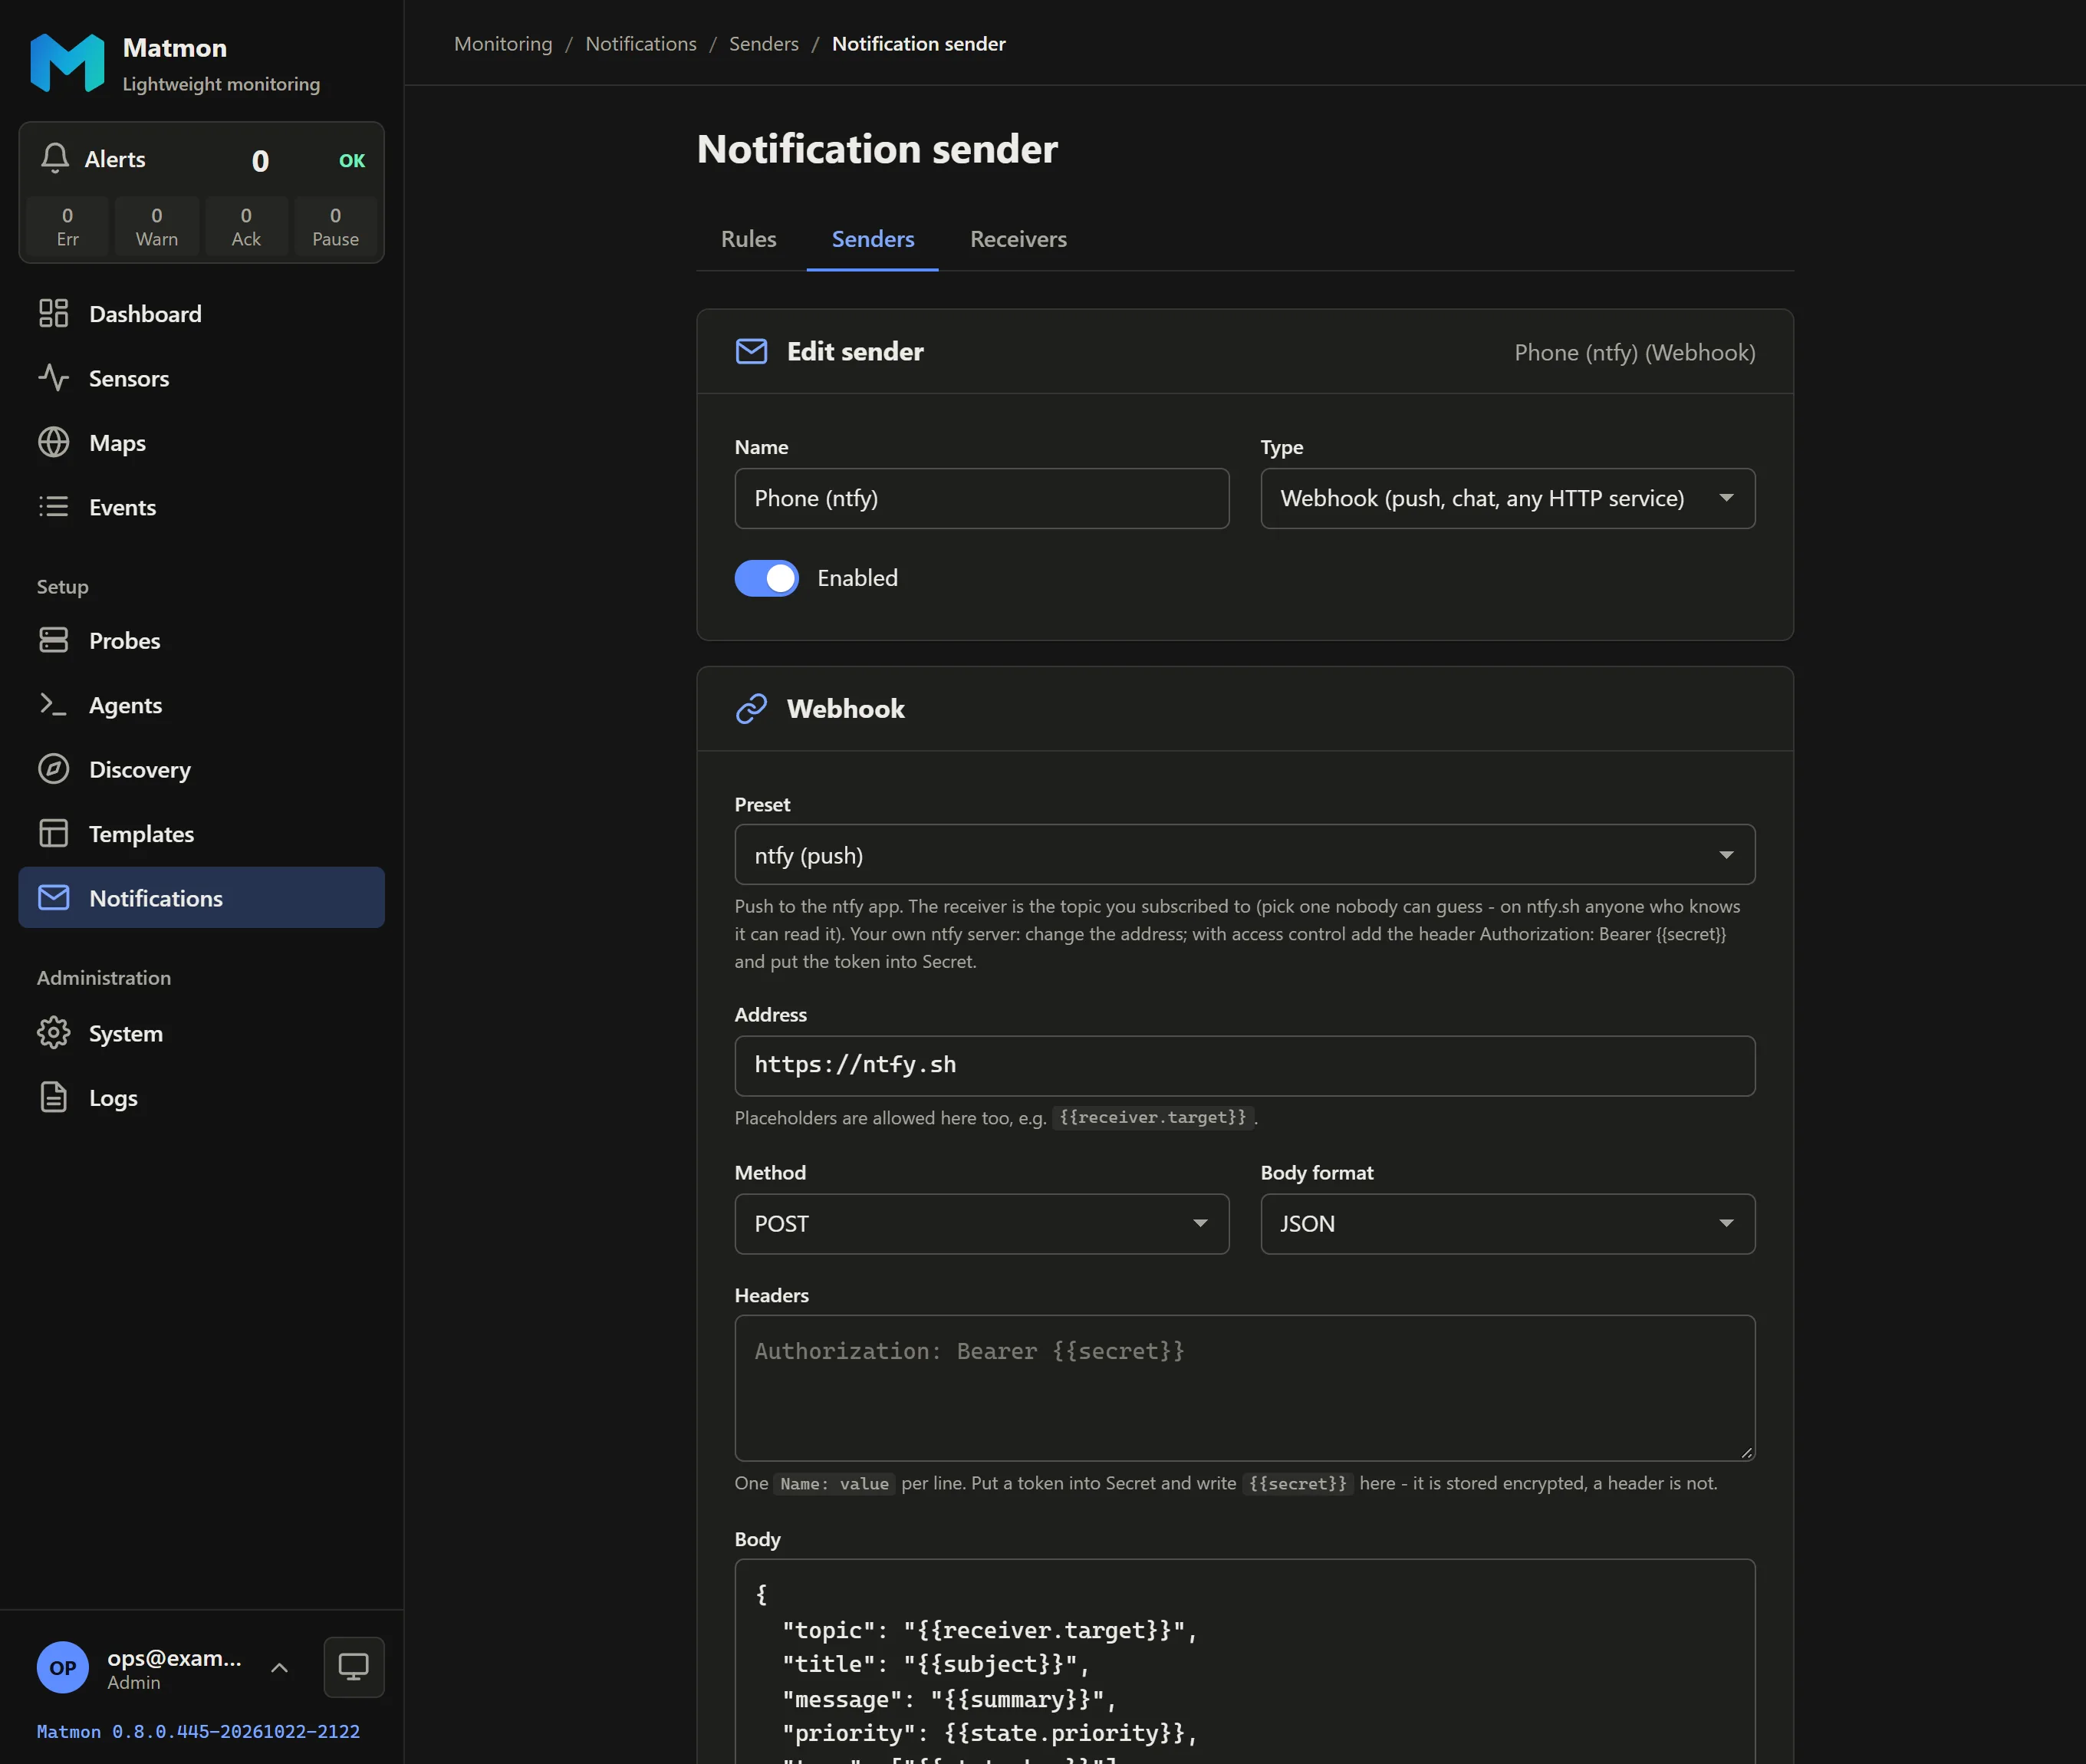
- E-mail, webhooks with presets for ntfy, Pushover, Gotify, Telegram, Teams, Slack and Discord
- Browser notifications on your phone or desktop
- Through Matmon Cloud: SMS and phone calls for the critical ones
Syslog and SNMP traps in one place
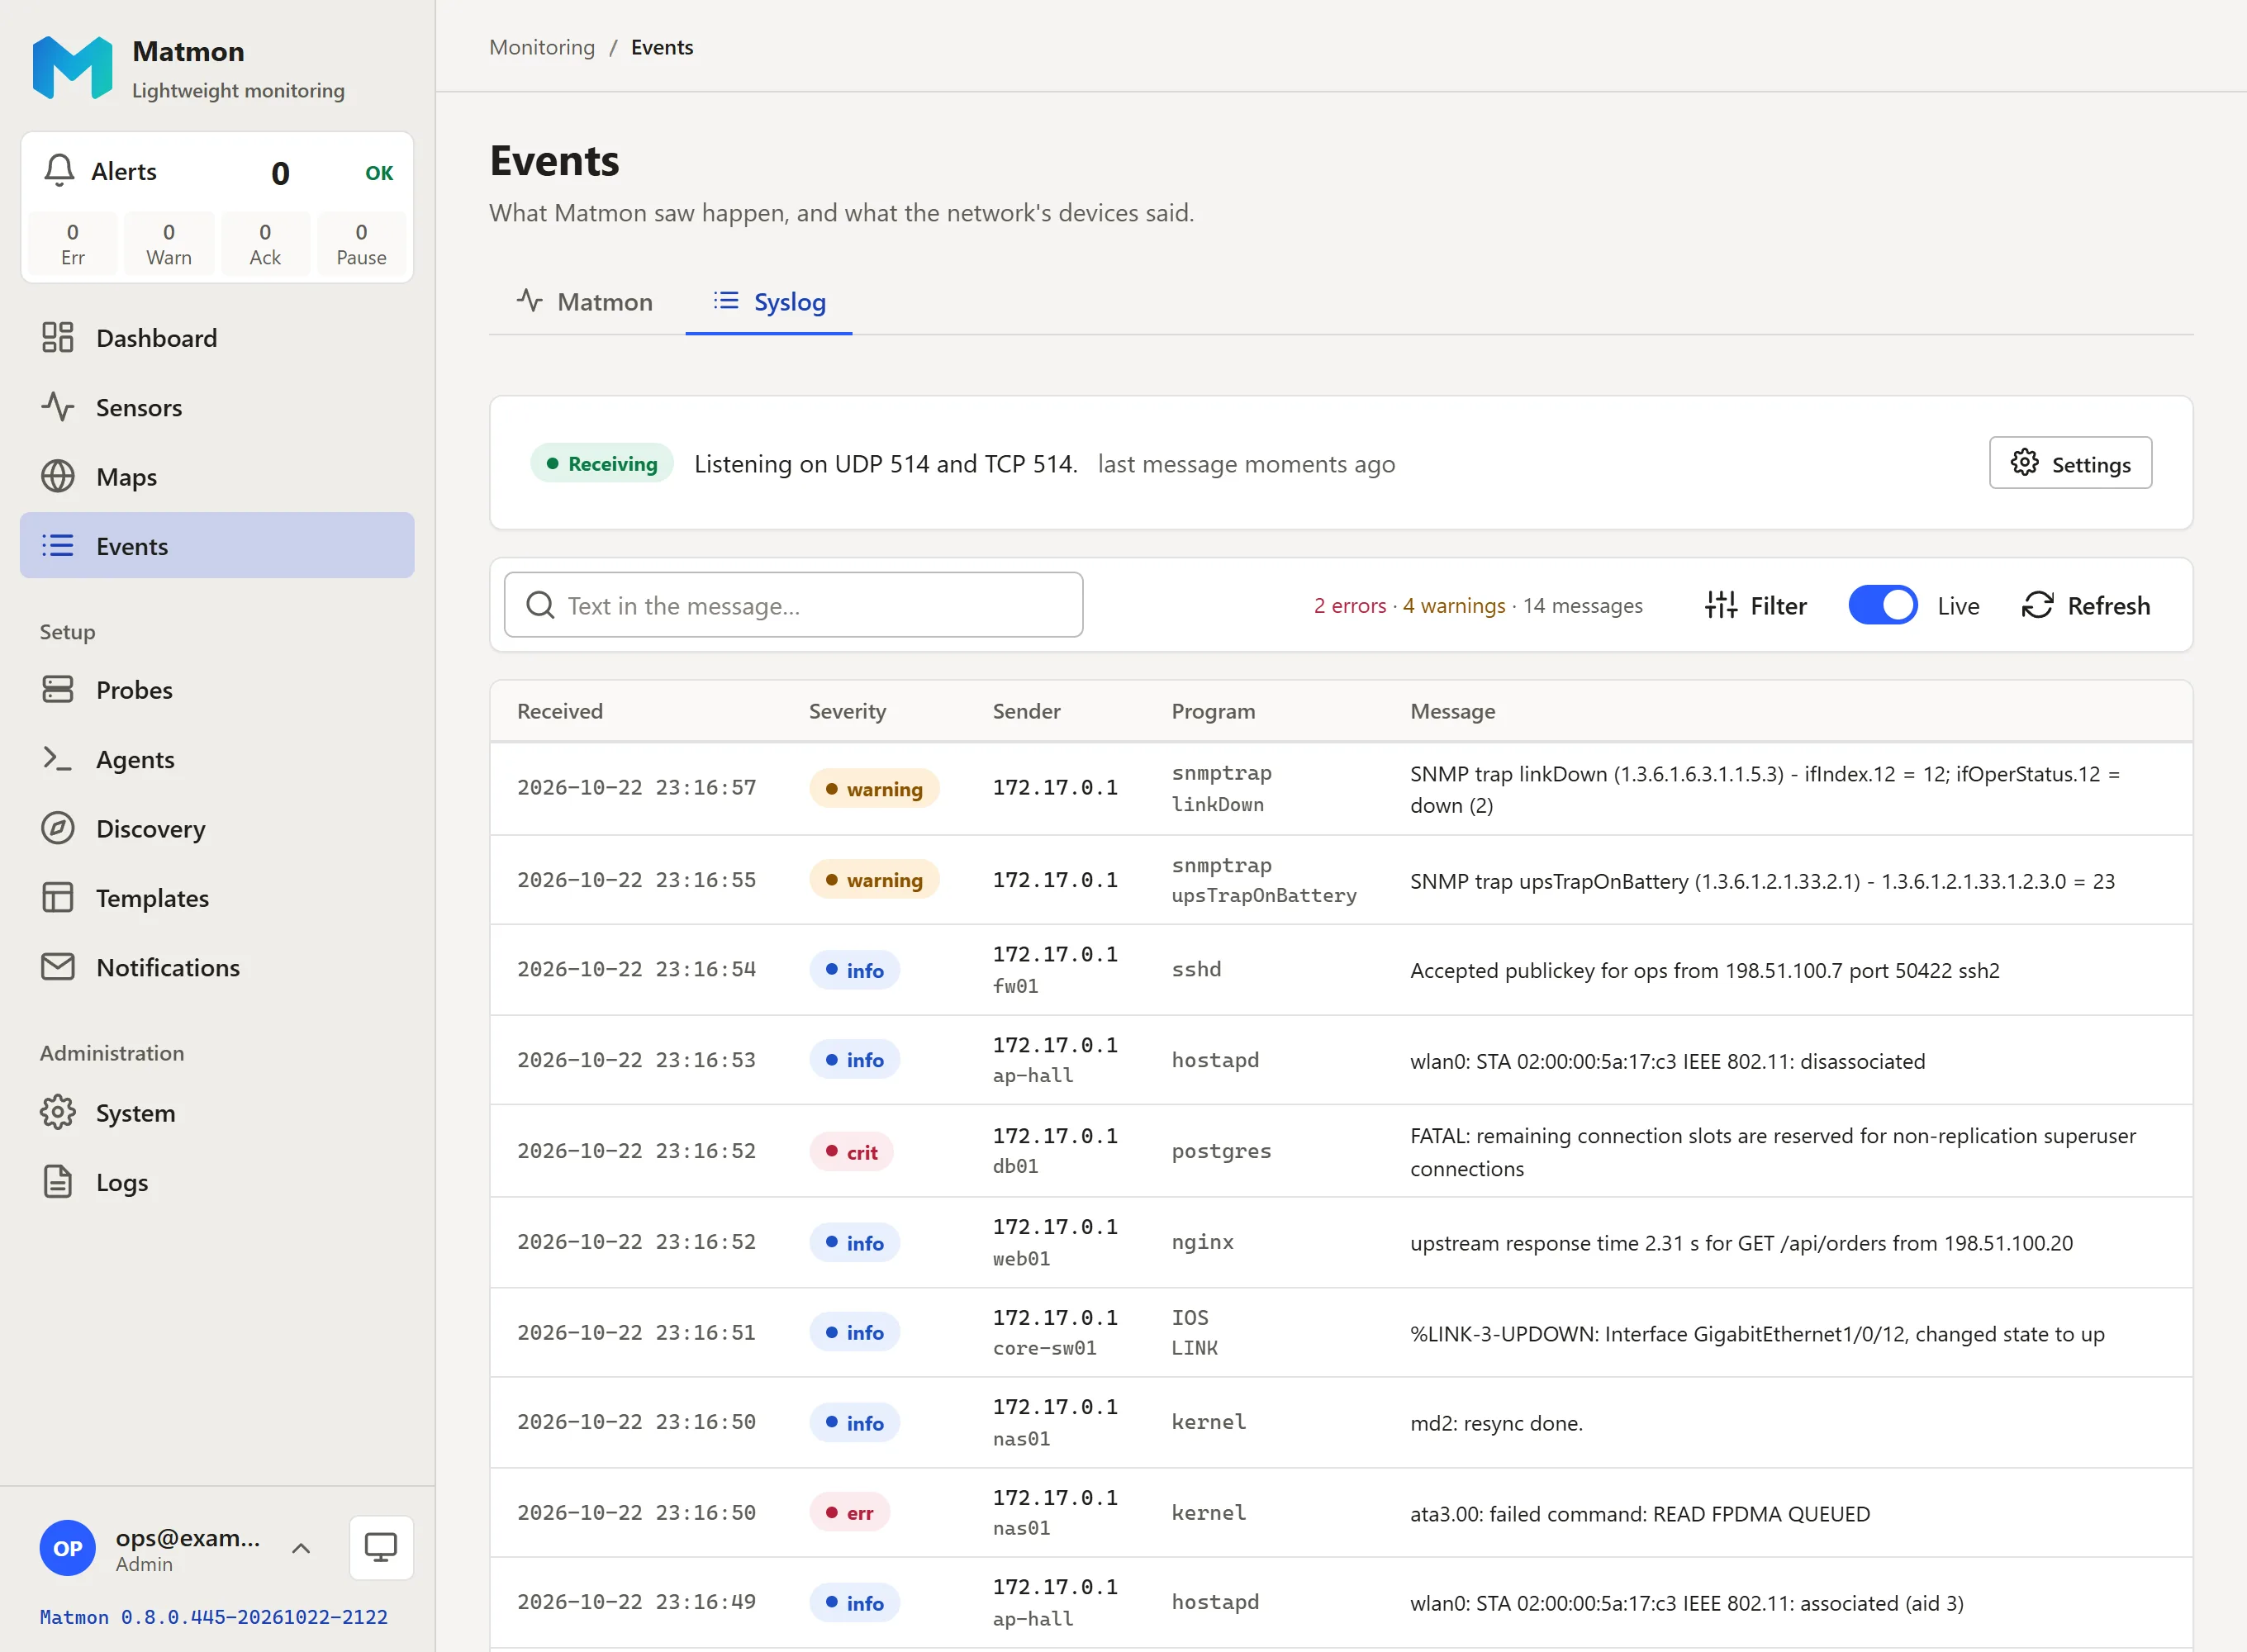
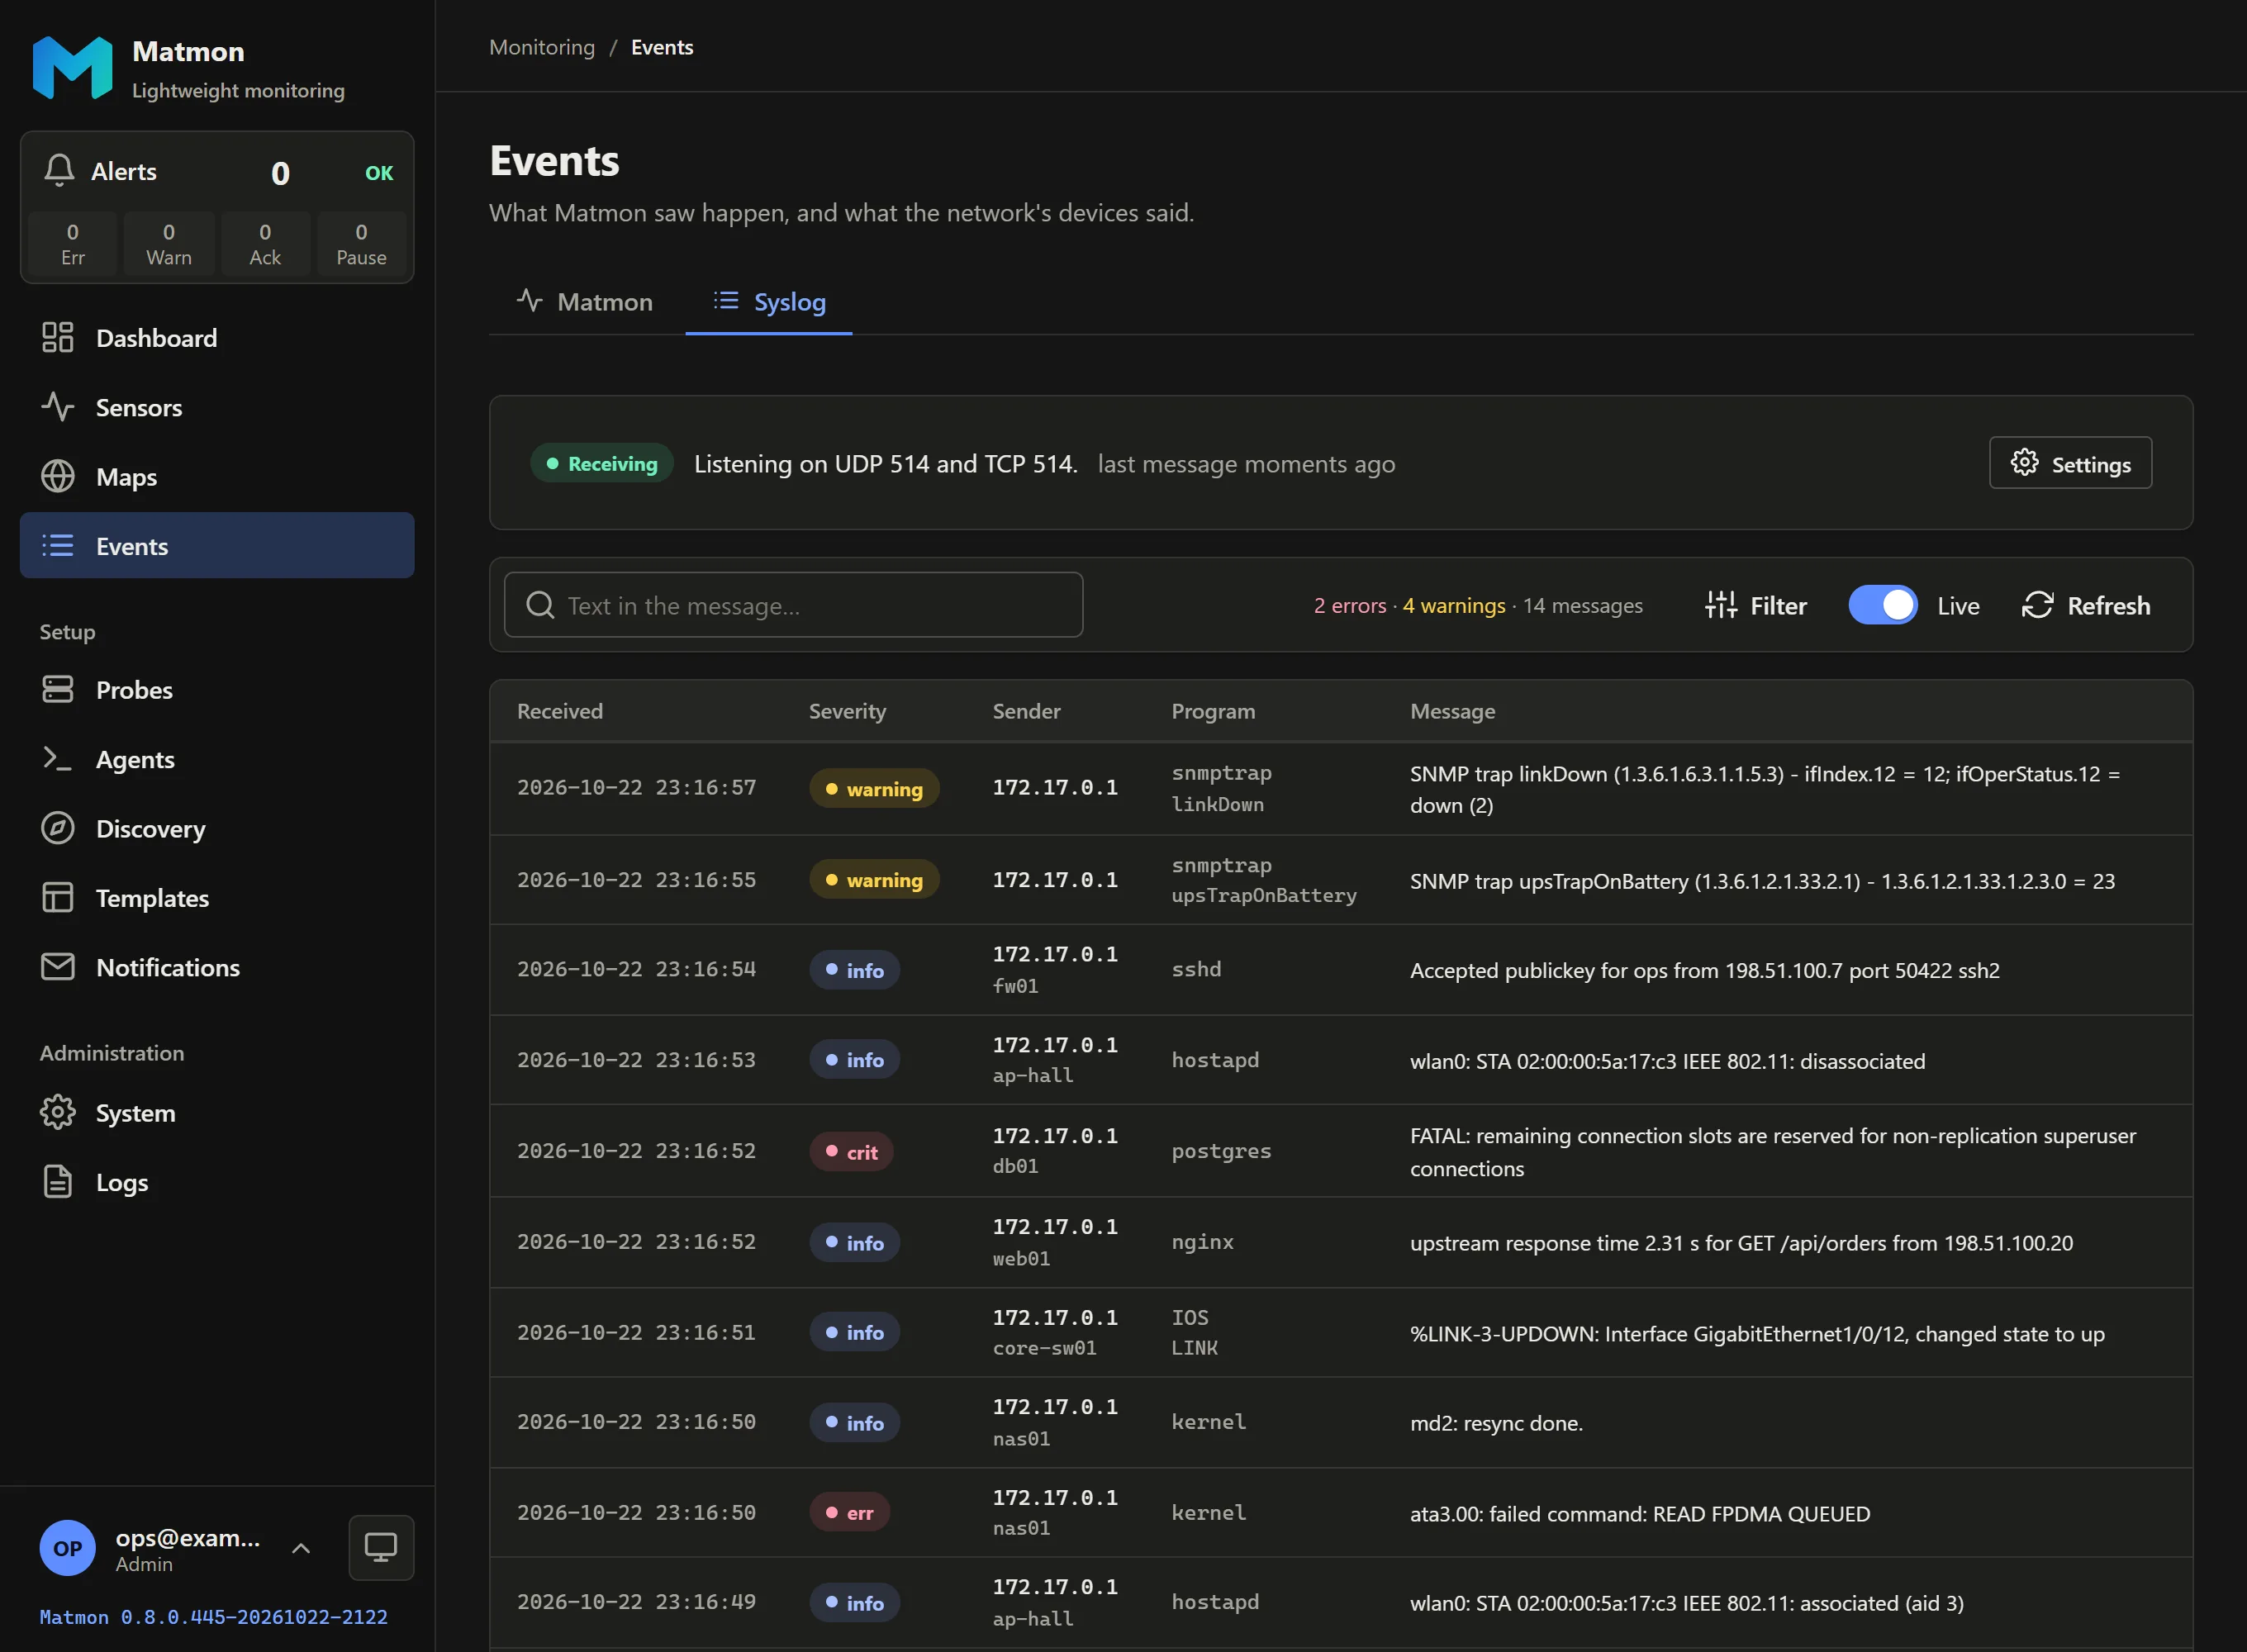
A syslog server (UDP and TCP) and an SNMP trap receiver (v1, v2c, informs and SNMPv3) – on the primary, or on a probe next to the devices, which keeps collecting while the primary is away.
- Searchable live – including what a switch forgets when it reboots
- A trap makes the device's sensors look at once: a UPS on battery is red within seconds
- Sensors that alarm on errors, warnings, silence or a phrase in the messages
Wallboards, summaries and audit reports
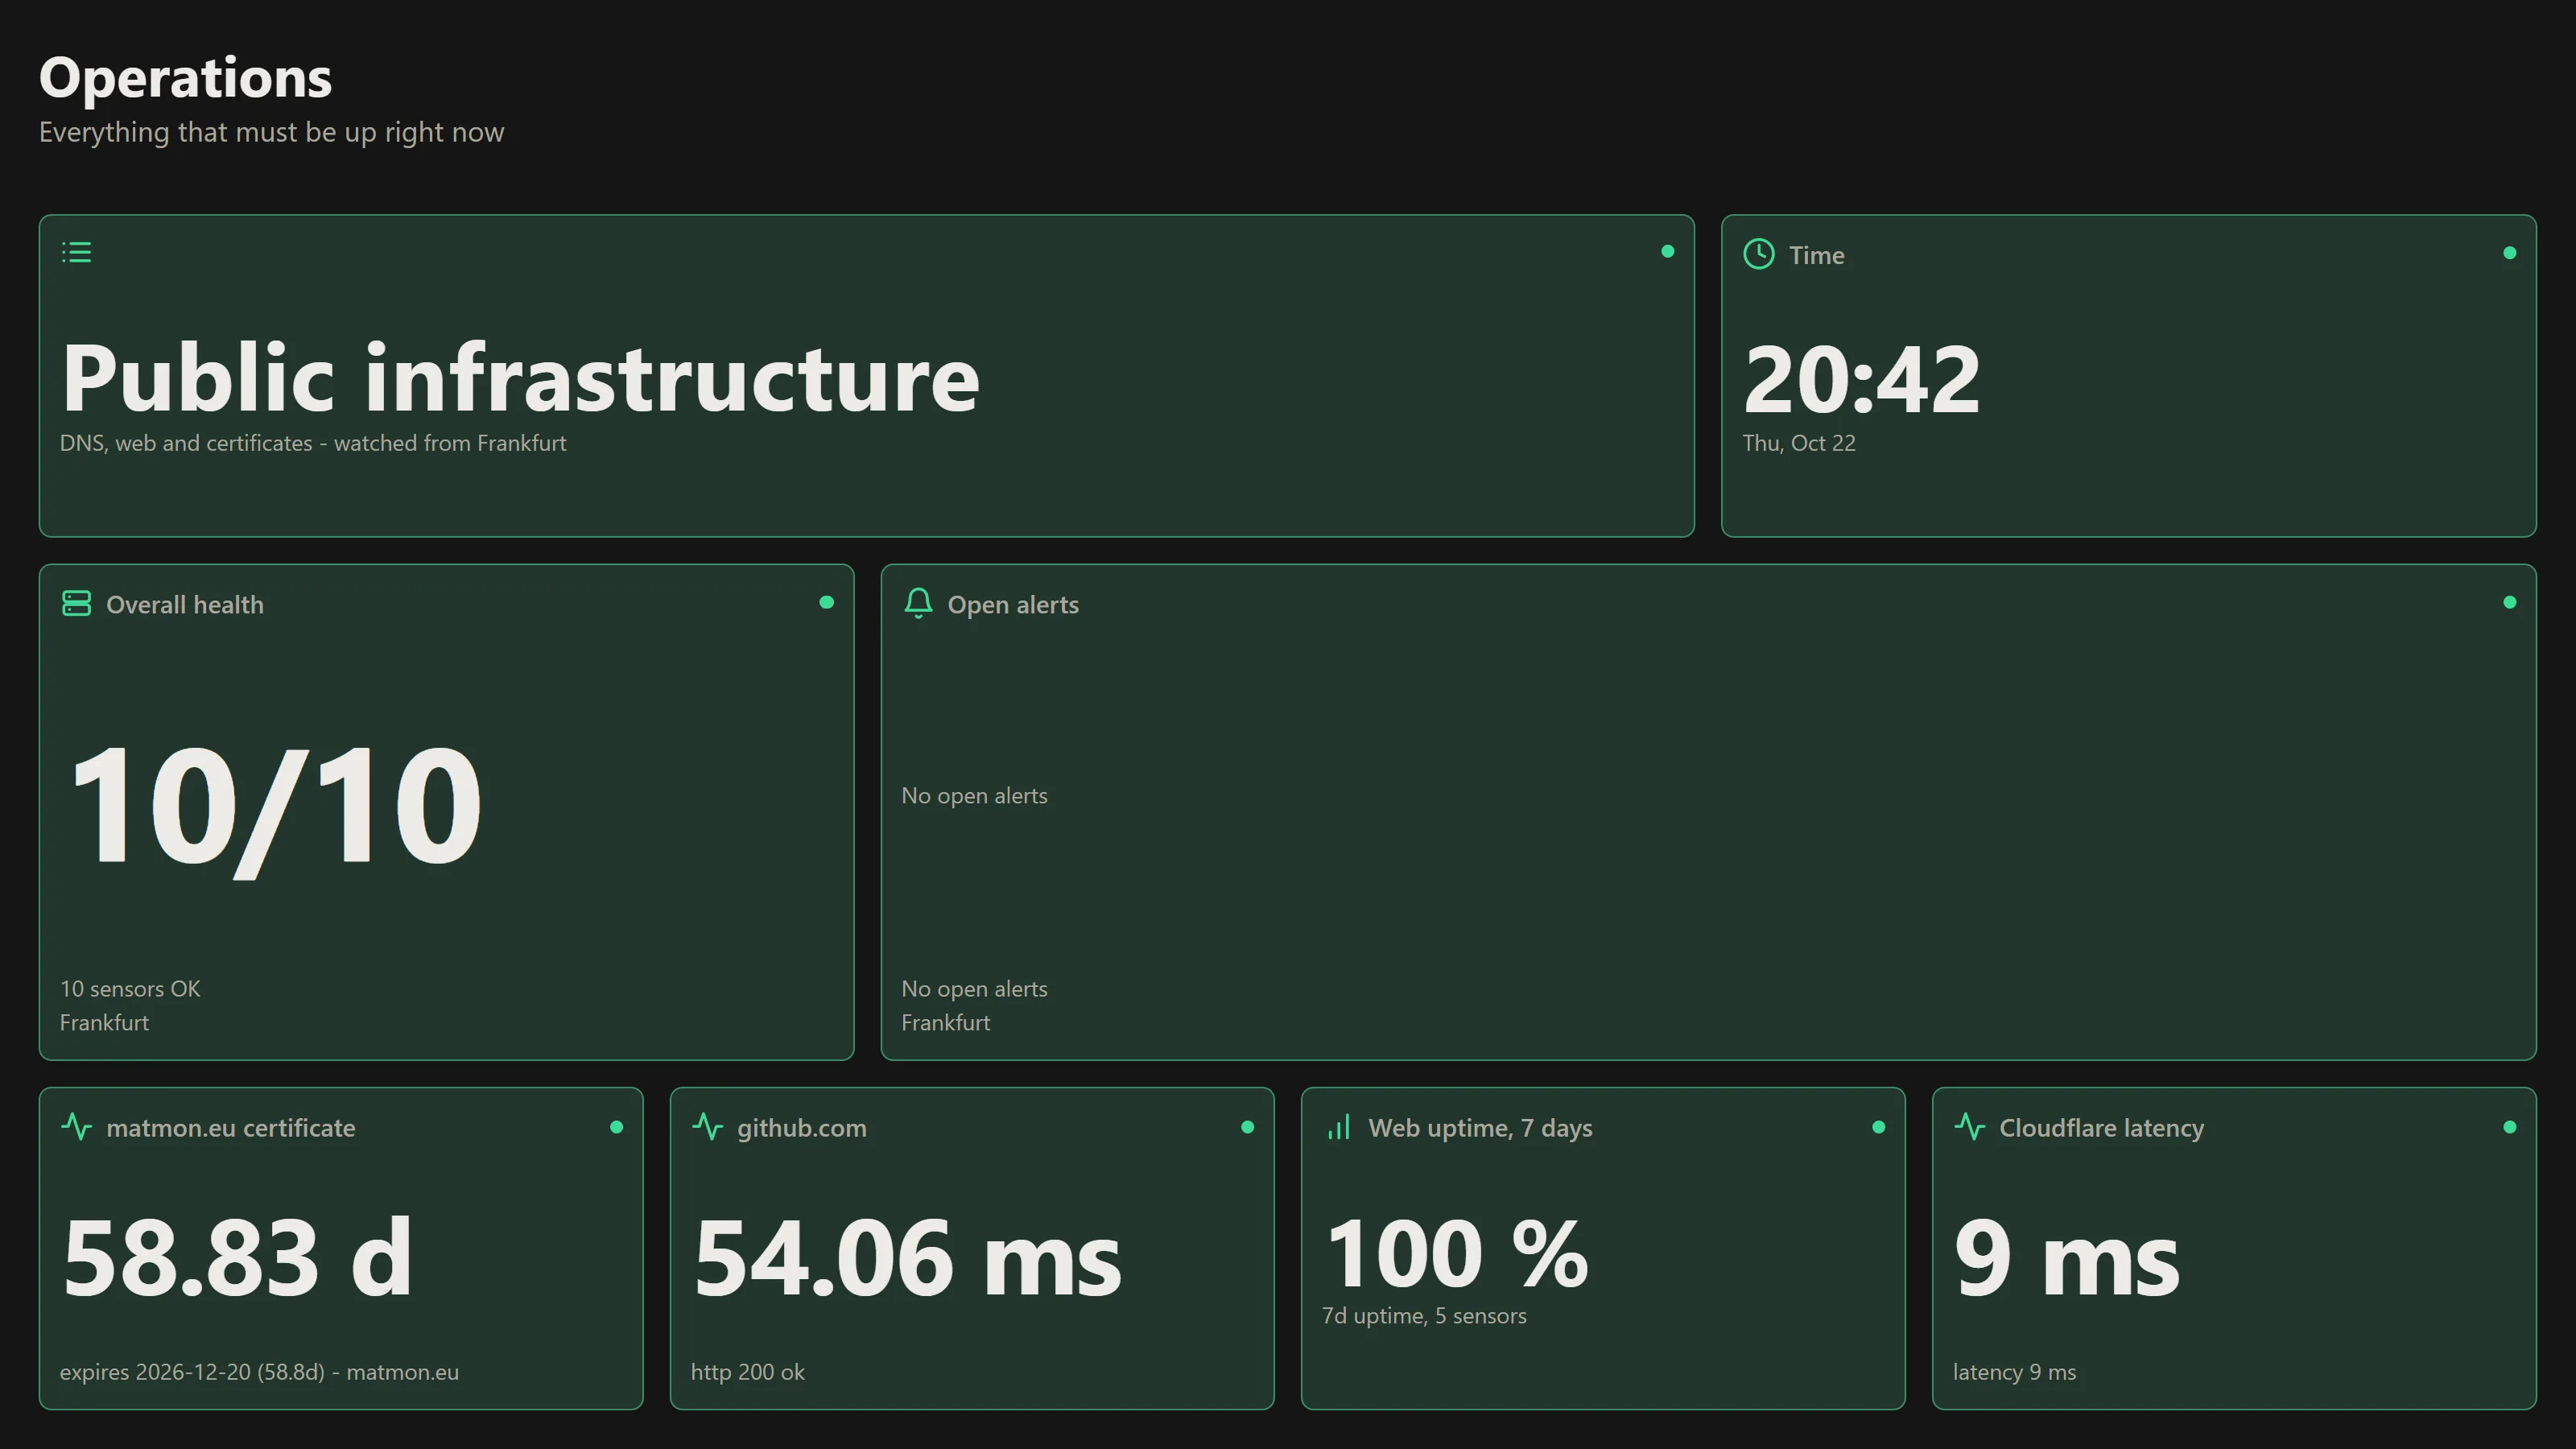
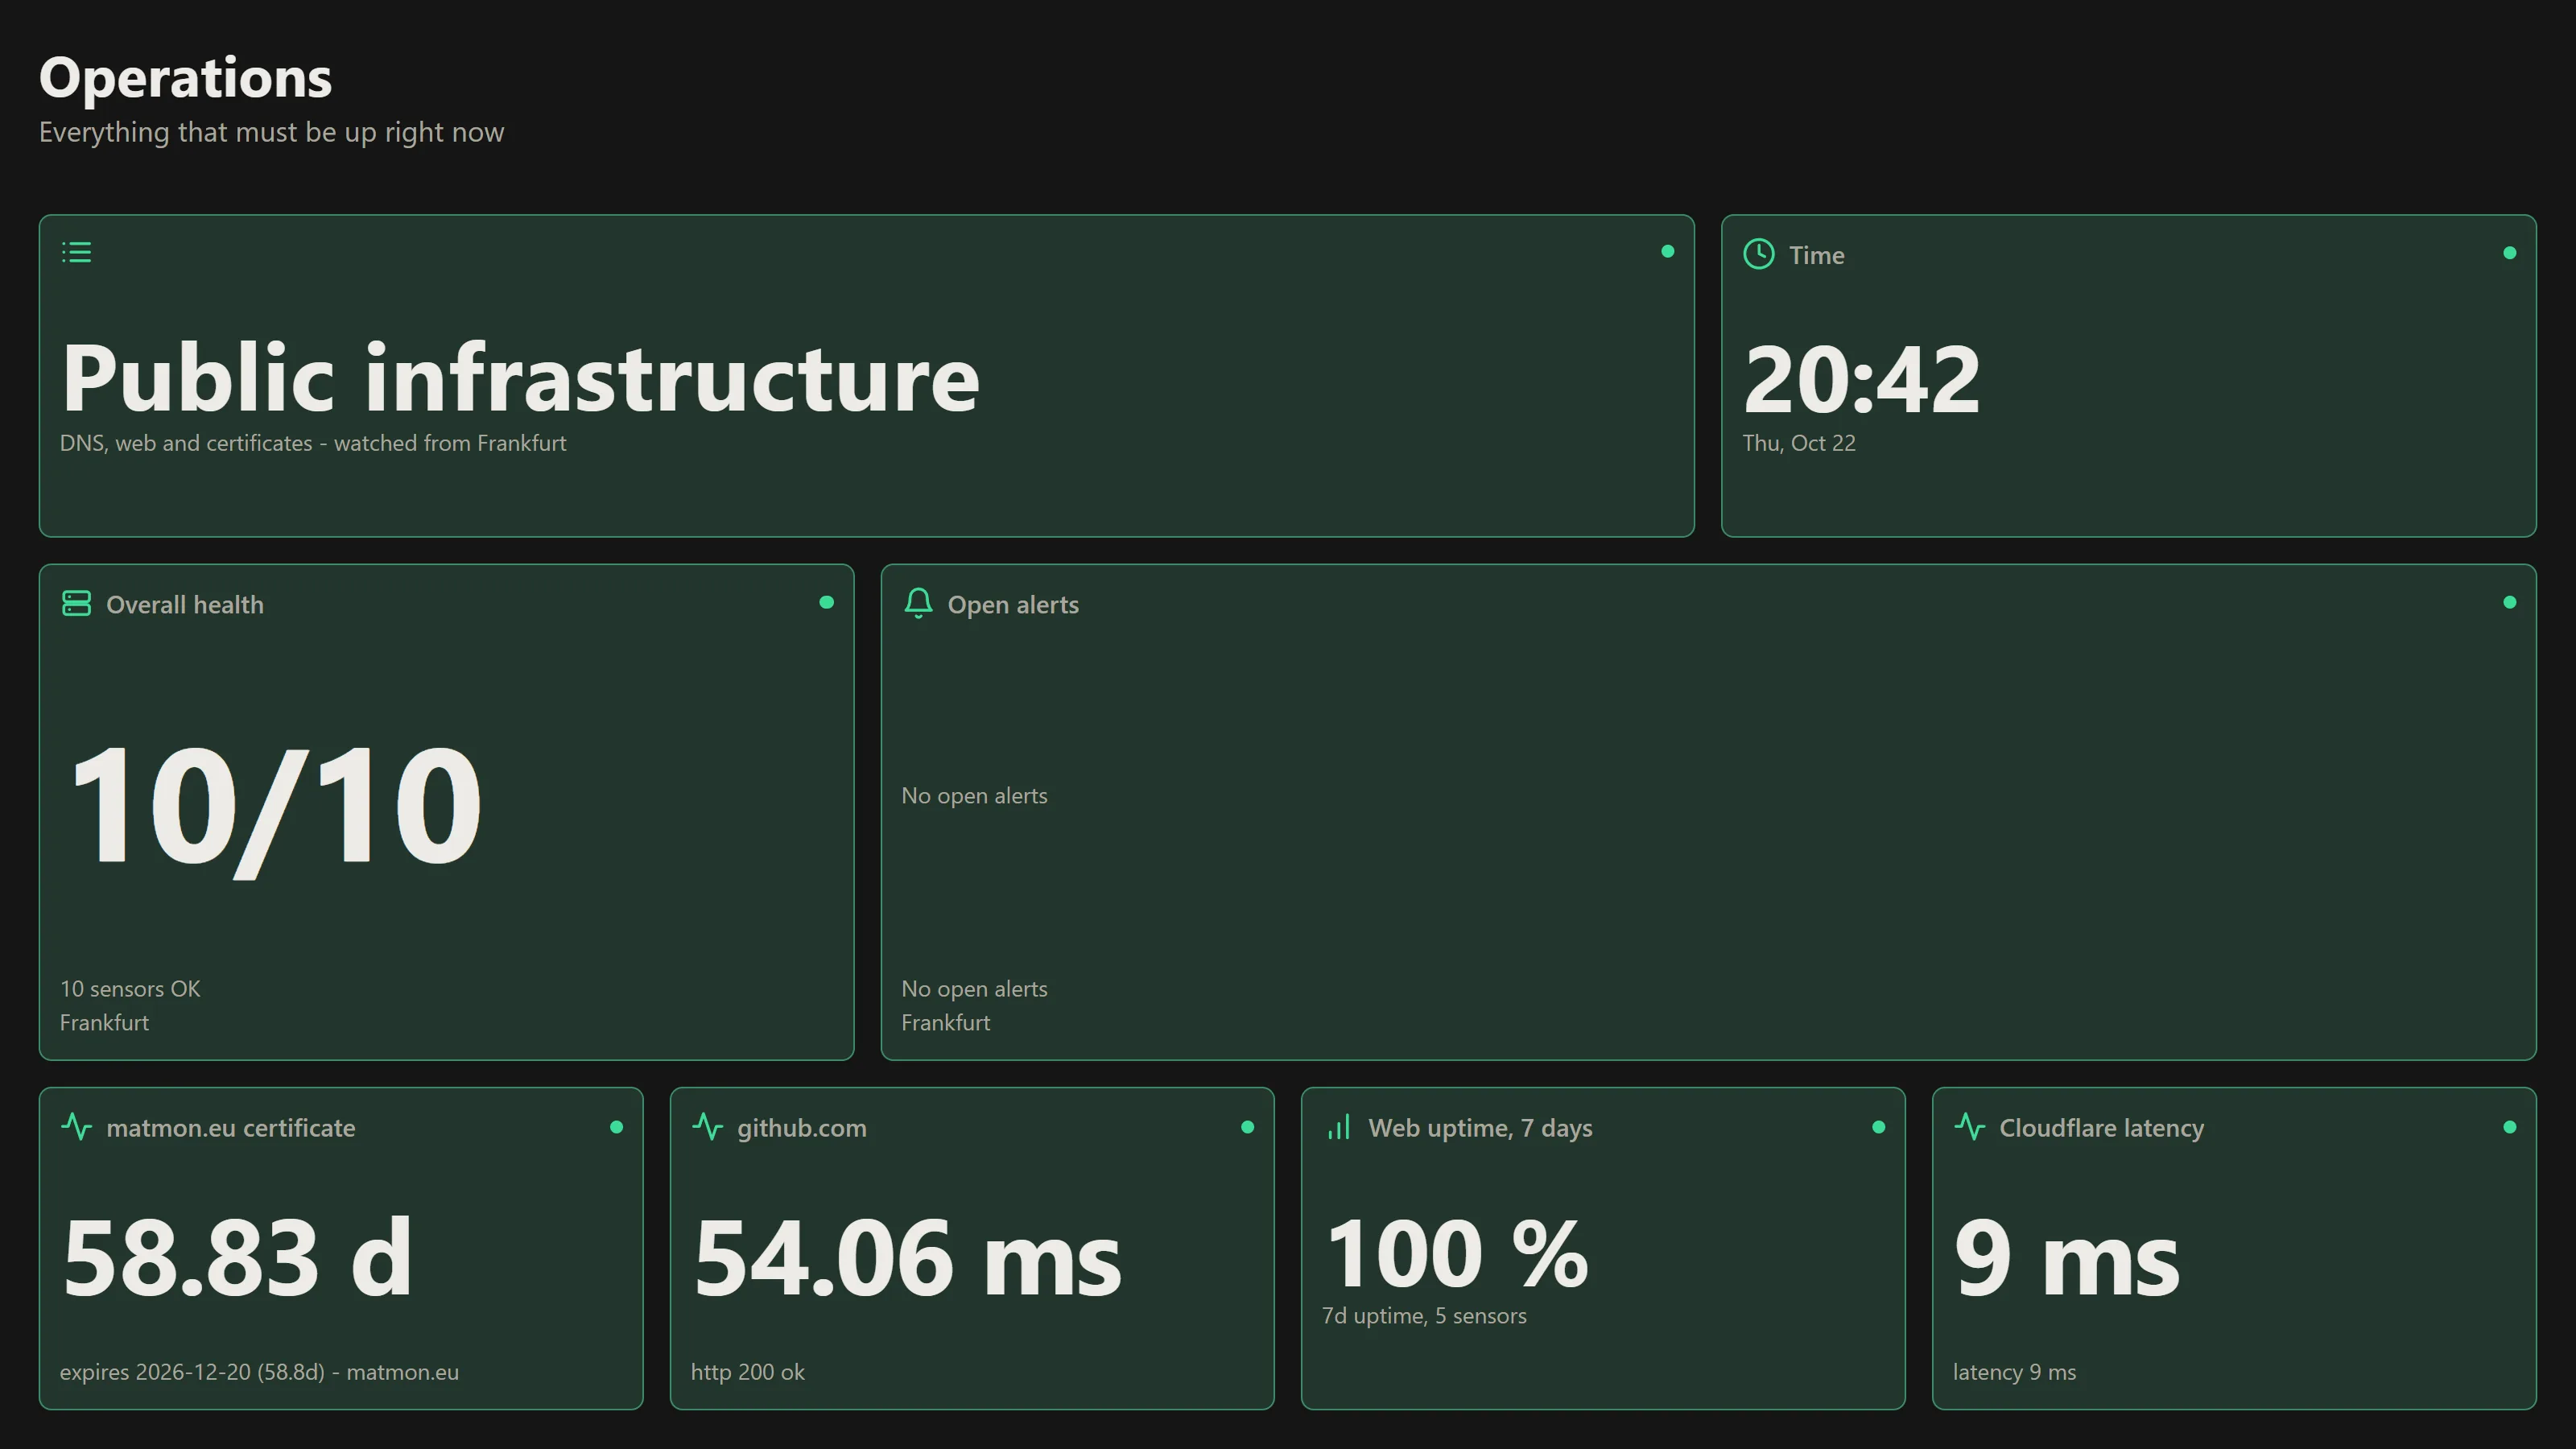
- Wallboards from gauges, graphs, lists, SLA and floor-plan widgets – roll up a subtree or a tag into one tile
- A read-only link for the screen on the wall
- A scheduled summary by e-mail
- A customer-ready PDF audit report with uptime, problems and the events of the period
Built to run unattended
The parts you do not see until you need them.
Reach without giving anything away
Your instance connects outbound to Matmon Cloud – no open port, no VPN. It adds what a monitor on site cannot do for itself. Entirely optional: without it, Matmon runs fully offline.
Primary → Matmon Cloud: outbound only
Heartbeat every 30 s over HTTPS 443. No inbound connections – remote access runs through a tunnel opened by the Primary.
Monitored networks
- Web UI and REST API
- Sensor scheduler
- Alerting and escalation
- History and reports
- Syslog / trap receiver
- Backups
All state in one data volume (/app/data). No cloud dependency.
Users and services
Transmitted
- Heartbeat every 30 s
- Polls its sensor assignments, run-now and discovery jobs
- Measurement results
Not transmitted
- No inbound connection to the probe site
- No connection to Matmon Cloud
Details
- Auth:
X-Matmon-Probe-Token - Primary unreachable: results buffered on disk (7 days / 100,000), replayed with original timestamps
Transmitted
- Same protocol as a probe: heartbeat, assignments, results
- Local metrics: CPU, memory, disks
- Update check against the Primary (hourly)
Not transmitted
- No inbound port, no WinRM or SSH required
- No connection to Matmon Cloud
Details
- Enrolment:
matmon-agent enroll --url … --code …(one-time code); plain HTTP to a public host is refused - Windows service (LocalSystem), systemd, launchd
- Self-contained binary: win-x64, linux-x64, linux-arm64, macOS
Transmitted
- Polling: ICMP, HTTP(S), DNS, TCP, SNMP, vendor APIs (Proxmox, Hyper-V, Synology …)
- Inbound: syslog UDP/TCP 514, SNMP traps UDP 162 – only with the receiver enabled
Not transmitted
- No software on the device
- Credentials not stored in plaintext – DataProtection-encrypted, also in backups
Details
- Devices in a remote network are polled by the probe in that network
- Receivers run on the Primary, a probe or an agent
Transmitted
- Web UI, REST API, wallboards (read-only links)
- Web push to the installed PWA
Not transmitted
- No external identity provider required – local accounts work offline
Details
- No built-in TLS: terminate HTTPS at a reverse proxy (
Matmon__TrustedProxies) - Access from outside without port forwarding: Full Access via Matmon Cloud
Transmitted
- Alert messages via SMTP
- Webhooks: ntfy, Pushover, Gotify, Telegram, Teams, Slack, Discord, custom
Not transmitted
- No relay through Matmon servers – except the “Matmon Cloud” sender
Details
- SMS and voice only via the Matmon Cloud sender, critical alerts only
Transmitted
- Heartbeat every 30 s: version, host name, counts (sensors, probes, maps, alerts), probe name / version / state
- Cloud sender: recipient and alert text; SMS / voice: summary only
- Backups (manual or scheduled): configuration, secrets encrypted; history optional
- Full Access: UI proxied through a WebSocket tunnel (wss) opened by the Primary
Not transmitted
- Measurement values in the heartbeat
- Credentials in plaintext
- Inbound connections to the Primary
- Traffic from probes or agents
Details
- Auth:
X-Matmon-Instance-Tokenafter a PKCE claim - Separate switches: alert relay, Full Access, backup target
- Link off: monitoring continues; SMS / voice, remote access and cloud backups unavailable
Look after your customers' monitoring
IT service providers manage their customers' instances in the partner portal: connect them, see their state at a glance, carry their own branding – and appear on the partner list of matmon.eu with their company profile and contact if they like.
- Customer instances connected and watched in one place
- Remote access to an instance without a VPN
- Your own branding
- A public profile with logo, e-mail and phone
See it on your own network
Install it in minutes, or ask a partner to set it up for you.